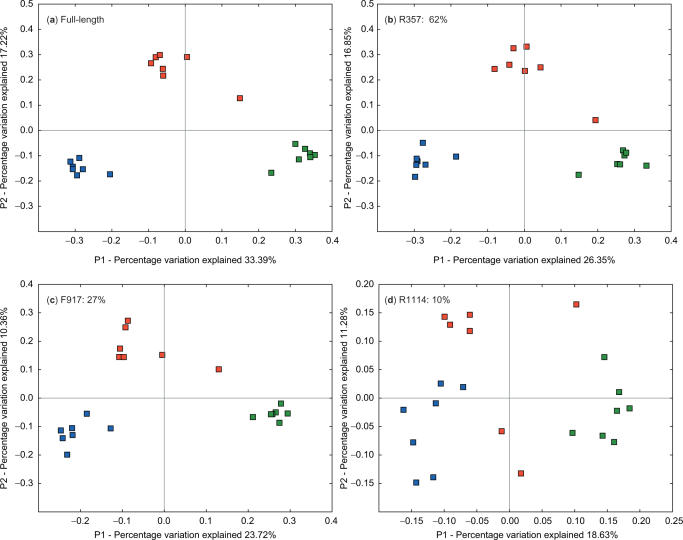
Figure 5.
UniFrac PCoA analysis of full-length human sequences, and three 100-base clipped sequence sets simulating 454 reads. The three different individuals are colored separately, with the same coloring applied to all three graphs. R357 and F917 recapture the overall pattern (discrete clusters for each individual) extremely well. In contrast, R1114 distorts the pattern substantially, and suggests separation of the three samples only along PC1. The percentage next to each primer number indicates the percentage of nodes in the hierarchical clustering on the full-length sequences that was recovered in the clipped sequences.

