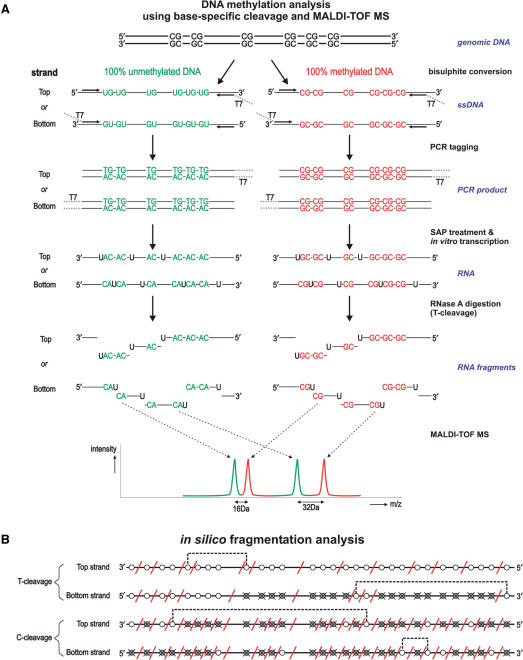
Figure 1.
MALDI-TOF-MS DNA methylation analysis. Overview of the MassCLEAVE™ assay. (A) Genomic DNA is bisulphite treated and PCR-tagged to include the T7 promoter sequence. As shown, either top or bottom strand can be used for amplification. Subsequent alkaline phosphatase (SAP) treatment, in vitro transcription using T7 R&DNA polymerase and a specific nucleotide mixture plus RNase A cleavage results in specific fragmentation. As exemplified, the top and bottom strands can have markedly different fragmentation patterns. The obtained mixture of fragments can be analyzed by MALDI-TOF-MS. Spectrum peaks representing methylated and unmethylated fragments are used to calculate methylation levels for every fragment. (B) In silico transcript fragmentation. The use of T- or C-cleavage mixtures on either the top or bottom strand of bisulphite-treated DNA can yield quite different fragmentation patterns. Here, the fragmentation of the CpG island of INHBB (chr2:119,998,230-119,998,596) is shown. CpG sites are represented by circles; white circle: methylation call will be obtained in the MassCLEAVE™ assay; crossed gray circle: methylation call will be missed, because fragments mass falls outside of spectral range of analysis; red diagonal line: approximate cleavage site; dotted line: combined methylation call due to overlapping peaks in spectrum. T-cleavage is more informative than C-cleavage when interrogating CpG islands due to RNaseA digestion after every CpG site in the C-cleavage reaction. (C) New schematic representation of DNA methylation data. Due to the specific fragmentation of a transcript, multiple CpG sites can be present within one fragment. Also, fragments with identical masses will show overlapping peaks in the MALDI-TOF-MS spectrum, resulting in a combined DNA methylation call. This new graphical representation of the DNA methylation incorporates all this information. The white circles represent the CpG sites that are analyzed in the MassCLEAVE™ assay. The crossed grey circles represent CpG sites that will be missed in the assay, and the red diagonal lines are the RNase A cleavage sites. The colored circles in the average view indicate the methylation calls given by the assay with the dashed lines linking these calls back to the CpG site(s) within the interrogated sequence. In the detailed view, the relative abundance of unmethylated, partially methylated, and fully methylated molecules is visualized as proportional bars for each fragment (white, gray and black bars, respectively). This view allows an in-depth graphical comparison of samples at the highest resolution possible.


