Figure 2.
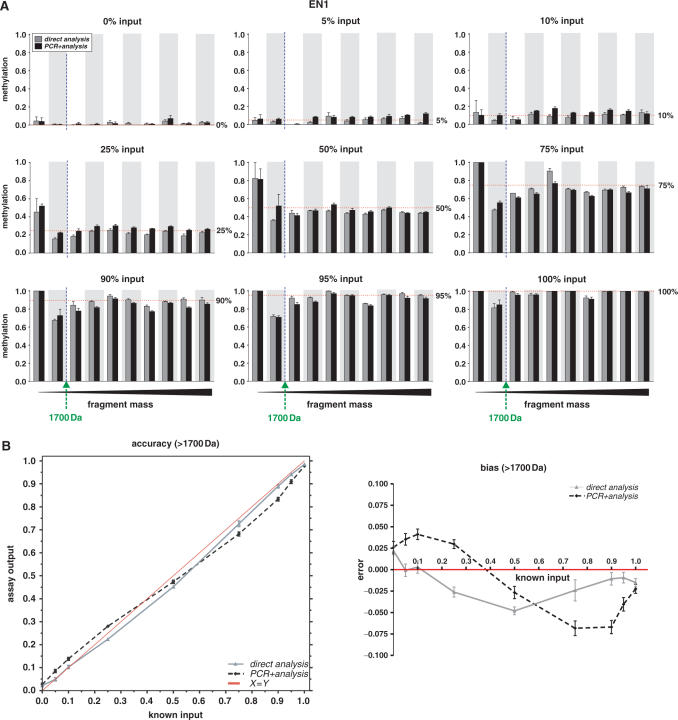
Accuracy and precision of MassCLEAVE™ DNA methylation detection in EN1 CpG island. The reproducibility and quantitation of different CpG methylation levels were assessed using MassCLEAVE™ technology (A) We measured the DNA methylation calls according to the MassCLEAVE™ technology, but using ASF (Supplementary Data). Known input ratios of completely methylated and unmethylated DNA fragments (referred to as 0, 5, 10, 25, 50, 75, 90 or 100% methylated input DNA; panels from upper left to lower right, respectively) were either analyzed immediately in a T7 transcription-RNase A digestion reaction, followed by a MALDI-TOF MS analysis (direct analysis, gray bars), or analyzed following an extra PCR step (PCR + analysis, black bars). For each panel, the methylation calls are arranged per fragment in an increasing mass order (x-axis) and the measured methylation ratios (y-axis) are given as means + SEM of five replicate measurements. The dotted vertical line indicates the 1700 Da threshold, and the horizontal dotted lines represent the input methylation levels. (B) Accuracy of DNA methylation calls by MassCLEAVE™ and PCR-induced bias. The left panel shows the mean DNA methylation calls of fragments with a mass over 1700 Da (y-axis) plotted against the input levels (x-axis), revealing a high correlation between input and output levels. The right panel shows the difference between the assay output and the known input (error) versus the input DNA methylation levels, revealing a small but consistent bias. The data for the direct analysis is plotted as a grey line and the data for PCR + analysis is shown as a dashed black line. Data are given as means + SEM of five replicate measurements. Similar accuracy and precision data for SCTR and INHBB CpG islands are given as Supplementary Data files.

