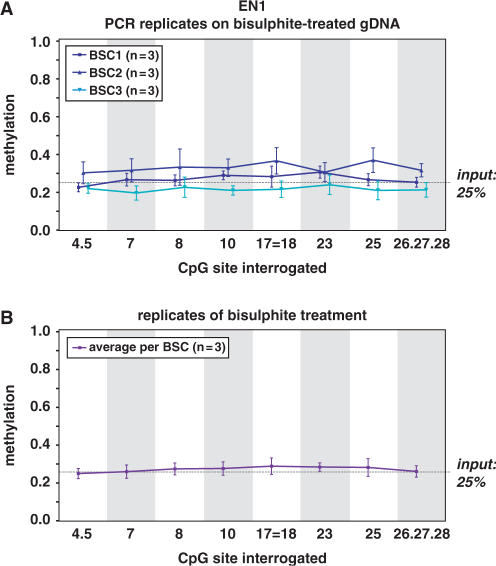
Figure 4.
Variability in DNA methylation quantitation. Methylation variability due to bisulphite conversion or PCR amplification was evaluated. (A) In three independent experiments, a mixture of 25% enzymatically methylated gDNA and 75% blood gDNA (generally unmethylated) was bisulphite treated in triplicate and EN1 CpG island PCR-amplified in triplicate. The mean + SEM results are graphed per bisulphite conversion (BSC) and per fragment. The numbers below the graph indicate which CpG sites are interrogated together in the respective fragment and the numbering of the sites is according to the position in amplicon. The point (.) between numbers indicates adjacent CpG sites present within one fragments, whereas the equals to sign (=) is indicative of CpG sites that are part of different fragments, but analyzed together because of identical fragment masses. The variability in the methylation calls shown in this graph is caused by PCR amplification of bisulphite-treated single-stranded DNA. (B) To be able to interrogate the variability introduced by the bisulphite conversion, we calculated the average methylation calls of the triplicate PCR reactions on the same bisulphite-treated gDNA, and used these values to graph the DNA methylation calls per fragment obtained from three independent bisulphite conversions. Similar variability studies for SCTR and INHBB CpG island regions are given as Supplementary Data files.

