Figure 6.
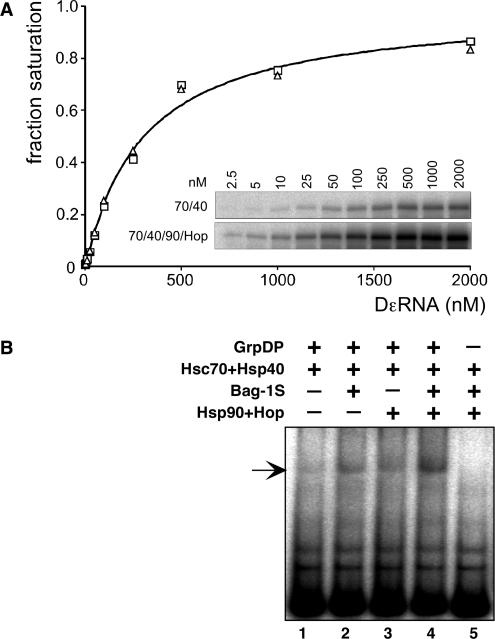
(A) Hsp90 does not affect the relative affinity of P* for Dε RNA. P protein–Dε complexes were reconstituted with only Hsc70 and Hsp40 (open squares), or in addition with Hsp90 and Hop (open triangles), and varying concentrations of Dε RNA. Complex formation was monitored by priming assays (inset), and signal intensities were quantified by phosphorimaging. Values were normalized against the calculated maximum intensity at saturating concentration of Dε (I[Dε]/Imax; ‘fraction saturation’), and plotted against the Dε RNA concentration. A hyperbolic saturation curve for a nominal apparent Kd = 0.3 µM, as indicated, fits equally well to both data sets. (B) Hsp90 plus Hop, like Bag-1S, increase steady-state levels of P–Dε complexes. Complex formation upon RT activation with the indicated chaperones and co-chaperones was monitored via RNA gel shift assay. The increases in signal strengths via stimulation by Hsp90/Hop, Bag-1S, or a combination of both, paralleled those observed in the corresponding priming assays.

