Figure 7.
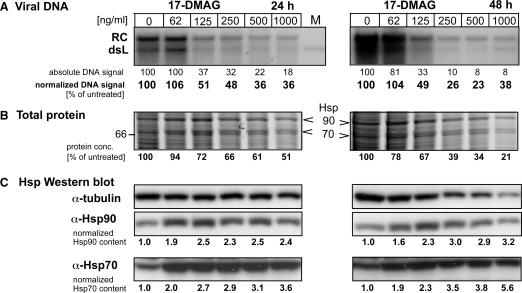
Effects of the Hsp90 inhibitor 17-DMAG on DHBV replication in transfected LMH cells. LMH cells were incubated with the indicated inhibitor concentrations 6 h prior to and during transfection with the DHBV expression vector pCD16. Cells were kept in the presence of drug for 24 h (left panels) or 48 h (right panels), then cytoplasmic lysates were prepared for viral DNA and cellular protein analysis. (A) Southern blot for viral DNA. Viral DNAs isolated from cytoplasmic nucleocapsids were detected using a 32P-labeled DHBV-specific DNA probe. RC denotes the typical 3 kb relaxed circular, and dsL the double-stranded linear DNA product of reverse transcription. Lane M contained a plasmid-derived 3.0 kb DHBV marker fragment. Band intensities were quantified by phosphorimaging, and the raw data are given below each lane relative to the untreated control set at 100% (designated absolute DNA signal). Correcting the raw data for total protein content of the corresponding lysates yielded the values designated normalized DNA signal. (B) Impact of 17-DMAG on total protein content. Aliquots from the same lysates used for viral DNA isolation were analyzed by SDS–PAGE analysis and Coomassie Blue staining. Only the section of the gel covering the molecular mass range between 60 and 100 kDa is shown (for the full range see Supplementary Figures S2 and S3). Note the relative increase of bands at around the 90 and 70 kDa position, shown in (C) to represent Hsp90 and Hsp70. Total protein concentrations determined by the BCA assay are given below each lane relative to the untreated sample set at 100%. (C) 17-DMAG upregulates Hsp70 and Hsp90 expression. Equal aliquots of the lysates were analyzed for Hsp90 and Hsc70/Hsp70 by western blotting, using chemiluminescent substrates; signals were quantified using an LAS3000 imaging system. Normalized values for Hsp90 and Hsp70 content were derived by correction for the total protein content in each lysate. Tubulin was simultaneously detected as a loading control. The decreasing tubulin signals with increasing drug concentration parallel the decrease in total protein content.

