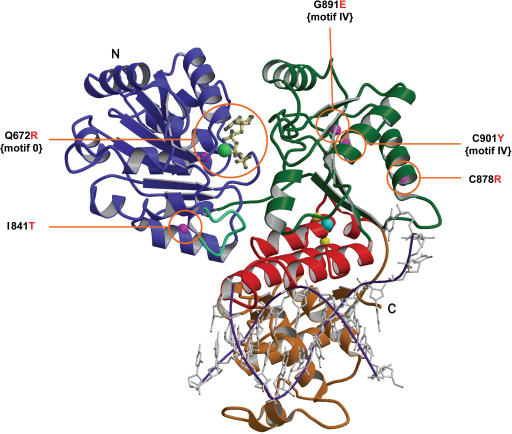
Figure 2.
Mutation sites in the modelled BLM structure. Ribbon drawing of the BLM helicase catalytic core, obtained after refinement of the structure generated by the Modeller computation (see text for details) with a trace of a partially unwound DNA molecule in a possible orientation, shown in purple and grey. This model is used to consider possible relationships between structure and enzyme activities. The N-terminal domains 1A (lobe 1) and 2A (lobe 2) are respectively coloured blue and green, the zinc binding domain is red, and the WH domain, gold. The conserved aromatic-rich loop is shown in blue-green. Labels N and C refer to the N-terminus and C-terminus, respectively. ATPγS is drawn in cream with a ball-and-stick representation, the manganese ion is shown as a light green ball and the zinc ion in cyan. Magenta spheres are the Cα positions of the five mutations studied in this article and observed in patients suffering from Bloom syndrome. Yellow spheres are the Cα positions of the two mutations in the zinc binding domain studied previously.

