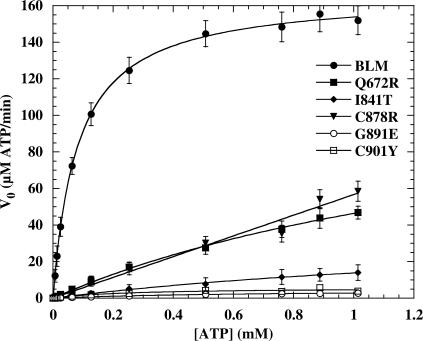
Figure 6.
ATP hydrolysis activity of the wild-type and mutant BLMs as a function of ATP concentration. Experiments were performed in ATPase assay buffer at 37°C with 0.5 µM ssDNA (nt, 60-mer oligonucleotide) and 0.1 or 0.2 µM of each enzyme. The ATP hydrolysis was quantified as described in ‘Material and Methods’ section. Solid lines represent the best fit of the data to the Michaelis–Menten equation. The apparent kcat and KM values obtained are summarized in Table 2.

