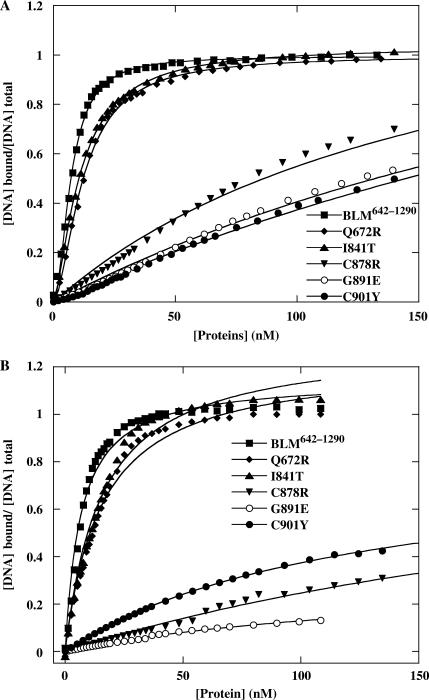
Figure 8.
The anisotropy-based DNA binding isotherms of wild-type and mutant BLM proteins. Fluorescence anisotropy values were determined as a function of BLM concentration for 36 mer ssDNA (A) and dsDNA (B) substrates. A total of 5 nM fluorescein-labelled DNA was titrated with increasing amounts of BLM as described in the ‘Materials and Methods’ section. The solid lines represent the best fits of the data to the Equation (2). The apparent Kd, values are summarized in Table 2.

