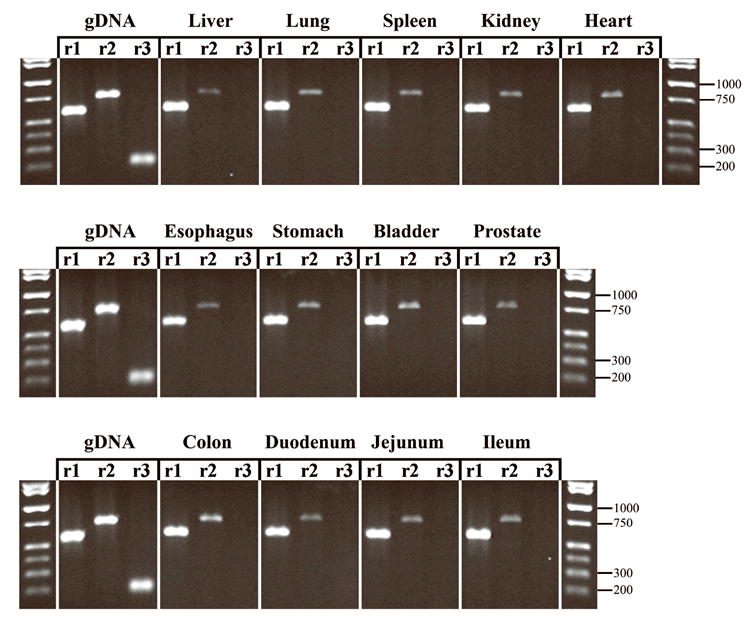
Figure 4.

Semi-quantitative RT-PCR of rat tissue cDNA. rNat1, rNat2, and rNat3 PCR products are shown side-by-side for each tissue tested. The genomic DNA (gDNA) control set demonstrates the expected PCR product size and the relative band intensities expected of a rNat1:rNat2 :rNat3 template ratio of 1:1:1 in the linear range of amplification. Key molecular weight markers are shown on the right side of each lane.
