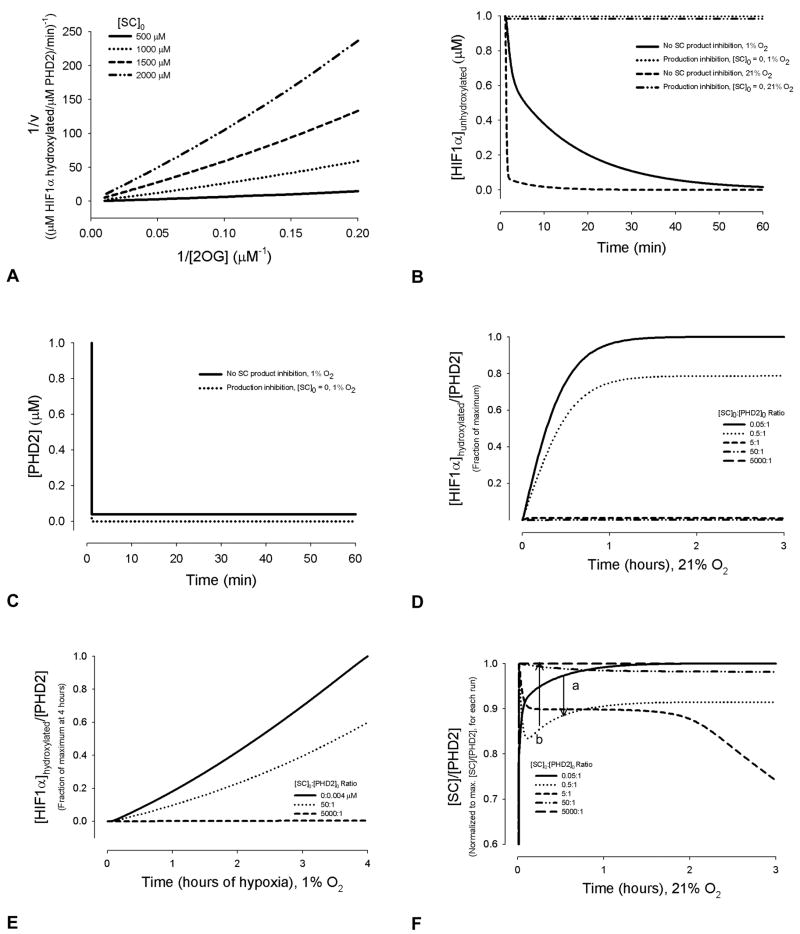
Figure 4.
Quantitative effect of succinate concentrations on HIF1α hydroxylation in normoxia (A), (B) and (D) and hypoxia (B), without synthesis of PHD2 or HIF1α. (A) The model reproduces competitive inhibition of PHD2 by succinate with respect to 2-oxoglutarate, as found in experiments [53]. If the lines are extended to zero (infinite concentrations of 2OG limit this calculation), they intersect near the y-axis. For this calculation, the Km value used for Fe2+ was 0.03 μM [75], and for 2OG, was 1 μM [53], for consistency with the compared reciprocal plots [53]. [Fe2+]0 = 5 μM. Other kinetic parameters were kept as default values [30]. (B) HIF1α levels during transient hypoxic or normoxic conditions, with and without SC production inhibition. (C) PHD2 levels during transient hypoxia, with and without SC product inhibition. (D) Initial succinate levels affect the dynamics of HIF1α concentrations, by altering the last two steps in PHD2 hydroxylation. Values are normalized to the maximum [HIF1α]hydroxylated:[PHD2] ratio at 24 hrs. (E) [HIF1α] to [PHD2] ratios during the first 4 hrs of hypoxia, and the effects of changing [SC]0:[PHD2]0, without HIF1α or PHD2 synthesis. Values are normalized to the maximum [HIF1α]hydroxylated:[PHD2] ratio at 4 hrs. (F) Succinate to PHD2 ratios as a function of time and initial concentrations. Below a [SC]0:[PHD2]0 ratio of 0.05:1, the curve for [SC]0:[PHD2]0 follows saturation kinetics (a). Above this ratio, there is a minimum present (b). As the initial concentration ratios increase above 5:1, the [SC]/[PHD2] ratio becomes approximately constant.

