
Figure 9.
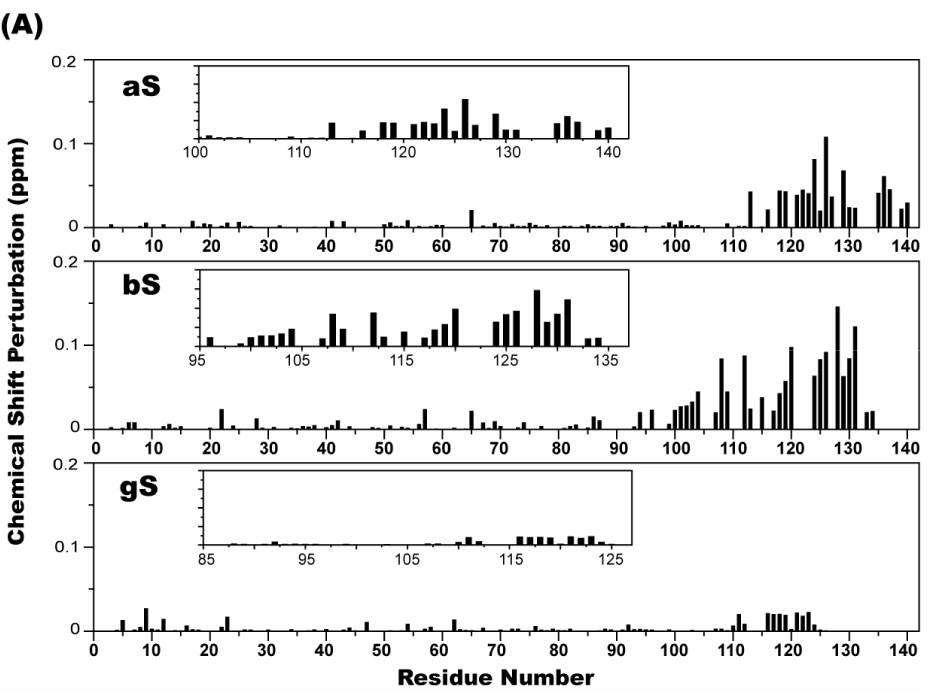
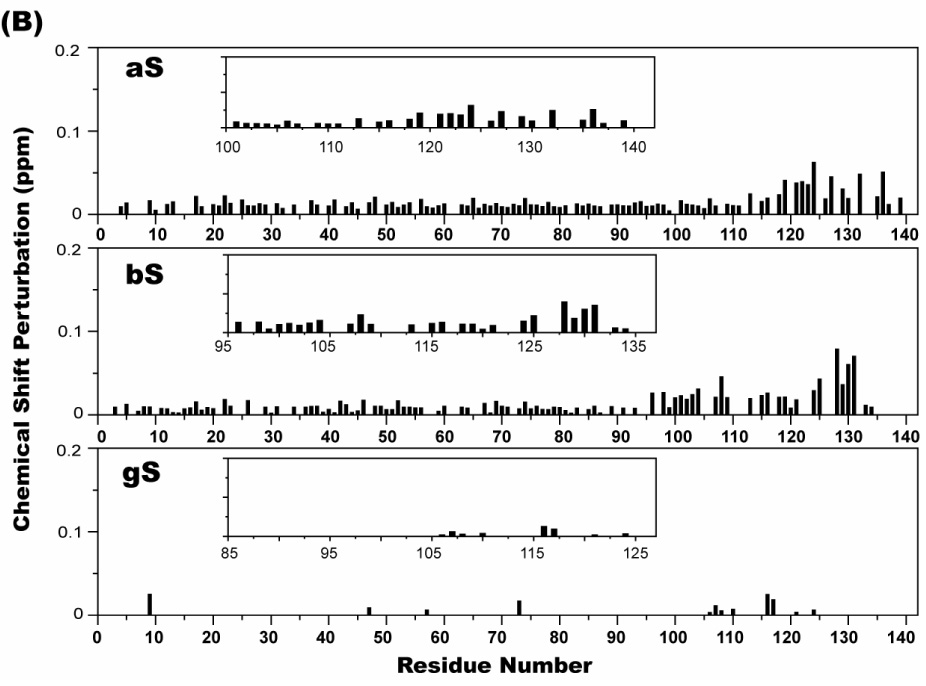
Chemical shift perturbations in ¹H- 15N HSQC spectra of 70 µM 15N-labeled aS, bS, and gS in the presence of 100 µg/ml poly-L-lysine (A), and 50 µg/ml poly-L-argine (B). The weighted average of the ¹H and 15N chemical shifts of a given residue was calculated as [(Δδ²NH + Δδ²NN/25)/2]1/2. The insets provide a blow up of the chemical shift perturbations in the C-terminal tail regions.