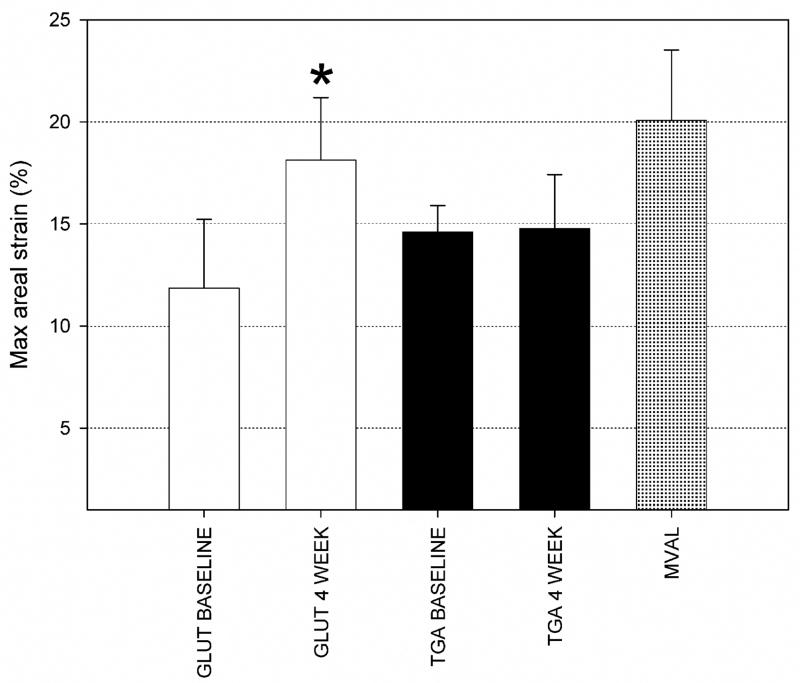
Figure 6.
Mean peak areal strain results for both implant groups and timepoints, along with the same data for the MVAL (taken from [16]). As for the peak radial strain (Fig. 5), only the GLUT group demonstrated a statistically significant change at 4 weeks, that may reflect the differences in tissue overgrowth (see Figure 3). Moreover, the total implant area changes at 0 weeks were ~12% for the GLUT group and ~15% for the TGA-MABP group, consistent with the increased stiffness of these materials compared to the native MVAL value of ~20%, with * indicating p ≤ 0.05.

