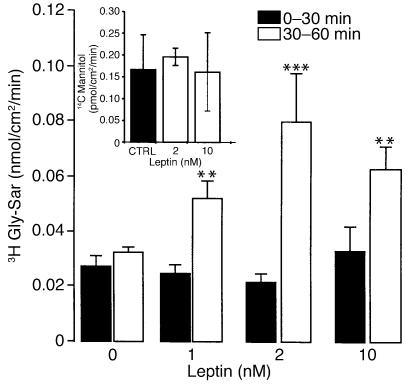
Figure 4.
Dose-response curve of Gly-Sar transport stimulation by leptin. Caco-2 cells were used at day 17. At time = 30 minutes, vehicle (0) or different concentrations of leptin (1–10 nM) were added to the apical compartment containing Gly-Sar. Basal apical to basolateral Gly-Sar or mannitol fluxes were measured between 0 and 30 minutes (Gly-Sar + vehicle or mannitol + vehicle) and compared with fluxes between 30 and 60 minutes (Gly-Sar + leptin or mannitol + leptin) as described in Methods. Inset: Effect of leptin (2 nM and 10 nM) treatment on apical to basolateral flux of 14C mannitol (0,5 μCi/well). Results represent mean ± SEM of six determinations. **P < 0.01 vs. control. ***P < 0.0001 vs. control.

