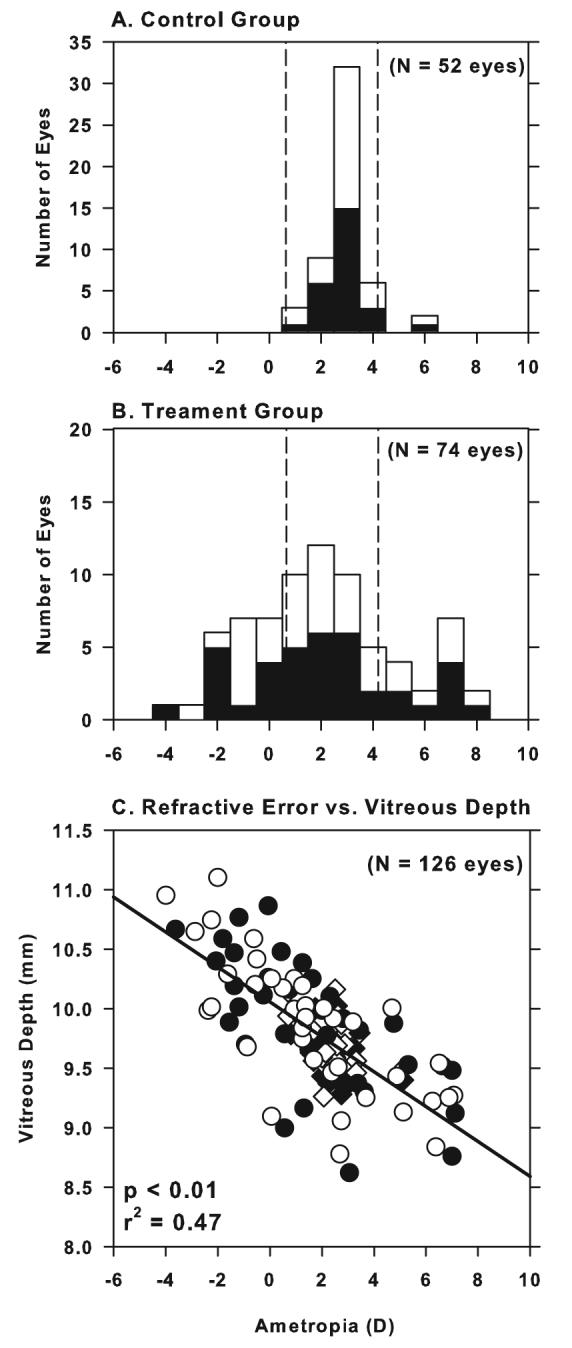
Figure 1.

Refractive error distributions for both eyes (filled bars = right eyes; open bars = left eyes) of (A) 26 normal control animals at ages corresponding to the end of the treatment period (mean = 143 ± 9 days) and (B) 38 treated monkeys at the end of the lens-rearing period (mean = 135 ± 17 days of age). The dashed vertical lines in (A) and (B) represent ± 2 standard deviations from the control group mean. (C) Vitreous chamber depth plotted as a function of spherical-equivalent refractive error for all normal (diamonds) and treated eyes (circles). The open and filled symbols represent left and right eyes, respectively. The solid line indicates the best fitting line determined by regression analysis for all the groups taken together.
