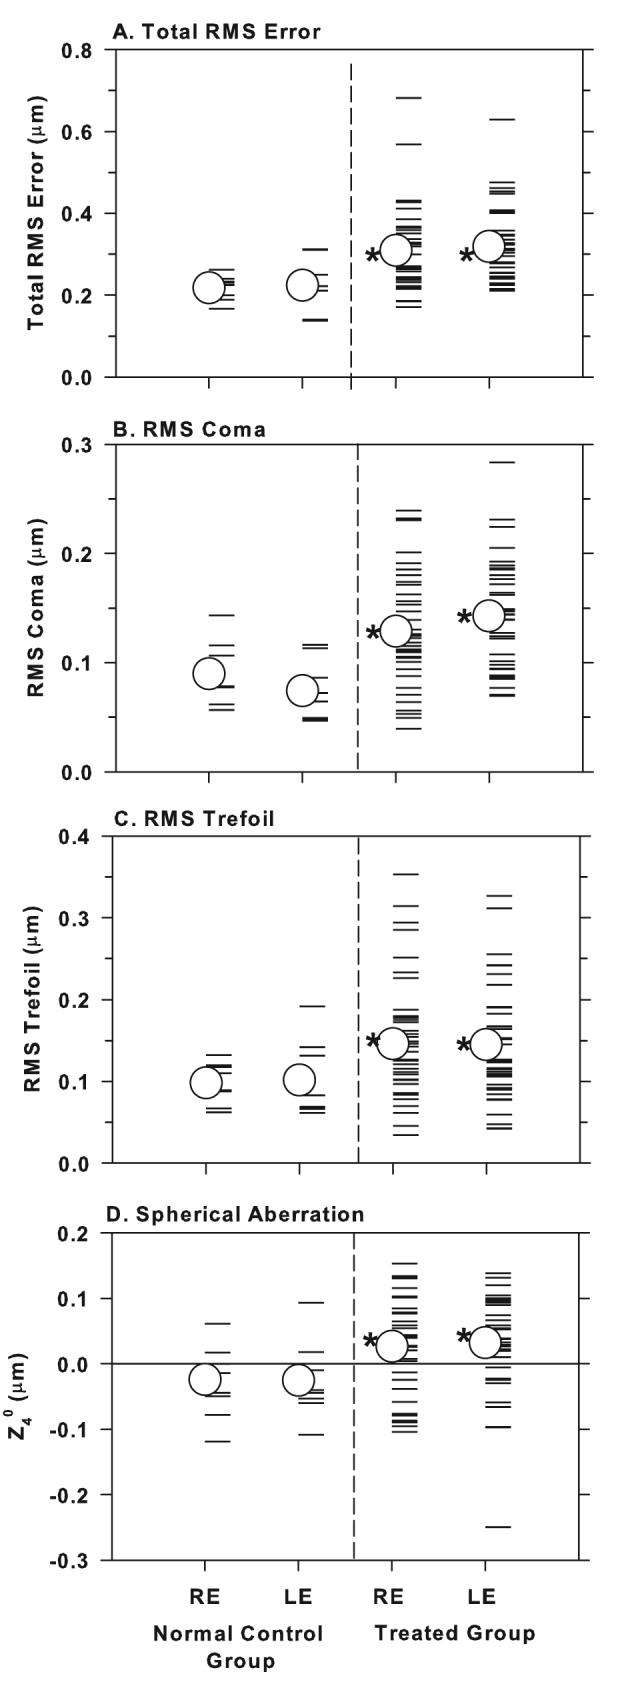
Figure 2.

Total RMS error (A), RMS coma (B), RMS trefoil (C), and the signed values for term Z40 (spherical aberration) (D) for the right and left eyes of individual normal and treated animals. The open circles represent the group means and the asterisks denote treated-group means that were significantly greater than the corresponding control-group mean (one-tailed, two-sample, t-test, P < 0.05).
