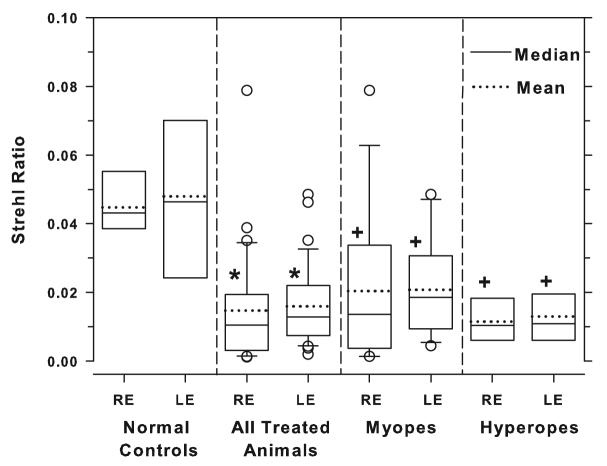
Figure 4.
Box plots of the Strehl ratios for the left and right eyes of the control animals, all of treated animals combined, and the myopic and hyperopic subgroups. The solid and dashed horizontal line inside each box denotes median and mean values, respectively. The edges of the box represent the 25th and 75th percentiles and the extended bars mark the 10th and 90th percentiles. The open circles denote data points that fall outside the 10th to 90th percentile limits. The asterisks (two-sample t-test) and plus symbols (one-way ANOVA and Tukey's pairwise comparisons) indicate that the mean values for a given group were significantly lower than that for the control eyes.

