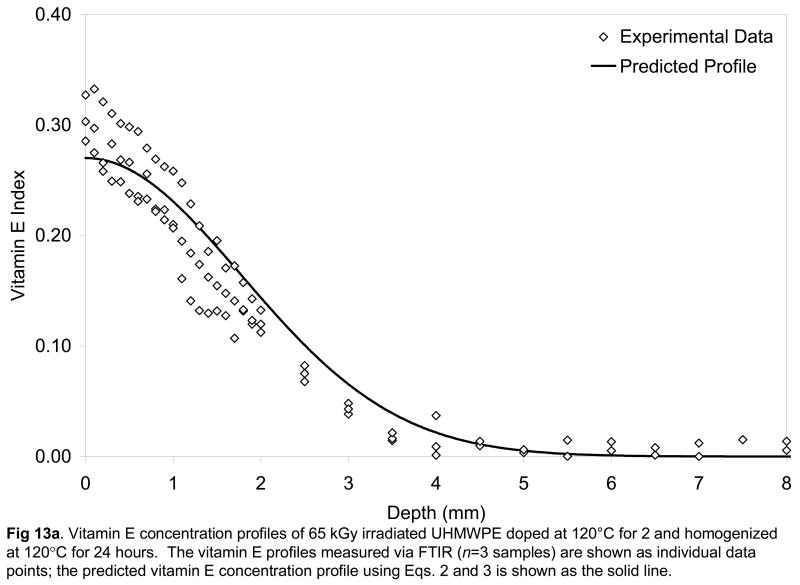
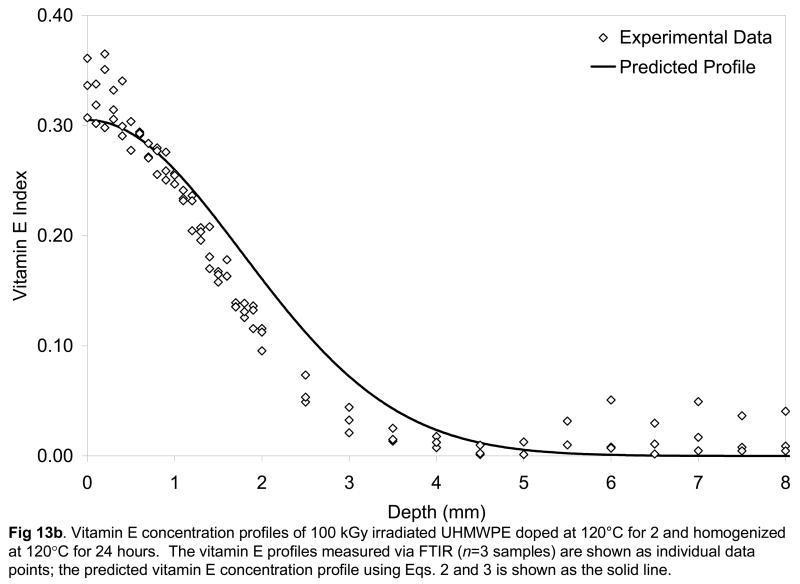
Fig 13.
Vitamin E concentration profiles of 65 kGy (a) and 100-kGy irradiated UHMWPE doped at 120°C for 2 and homogenized at 120°C for 24 hours. The vitamin E profiles measured via FTIR (n=3 samples) are shown as individual data points; the predicted vitamin E concentration profile using Eqs. 2 and 3 is shown as the solid line.


