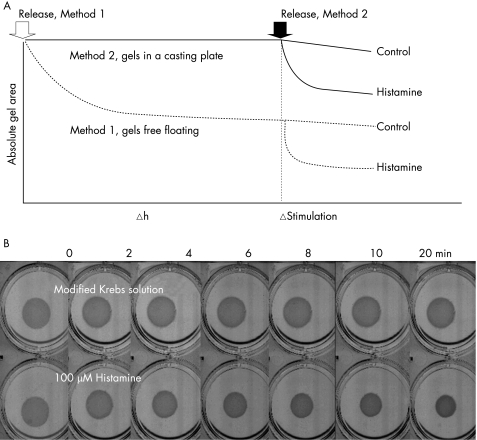
Figure 1 (A) Schematic diagram representing methods 1 and 2. Arrows indicate the time of detachment for method 1 (open) and method 2 (black). The triangle denotes the time point for agonist stimulation. (B) Representative images showing the time course of gel contraction to histamine (100 µM; bottom) compared with Krebs control (top).

An official website of the United States government
Here's how you know
Official websites use .gov
A
.gov website belongs to an official
government organization in the United States.
Secure .gov websites use HTTPS
A lock (
) or https:// means you've safely
connected to the .gov website. Share sensitive
information only on official, secure websites.
