
Fig. 2. Distribution of single channel conductances produced by 5 μm C2-ceramide.
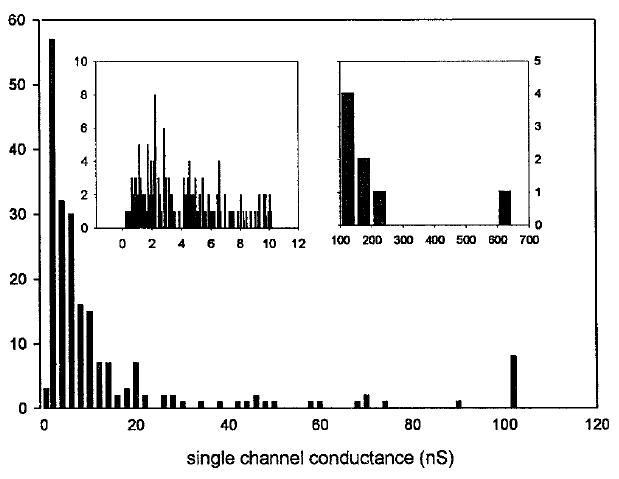
Data were compiled from four separate experiments using the conditions stated for Fig. 1, a–c. Only distinct vertical current increments were measured. The left and right insets are detailed distributions of channels with single channel conductances below 10 nS and greater than 100 nS, respectively.