
Fig. 4. The average size of ceramide channels increased with increasing ceramide content in the membrane.
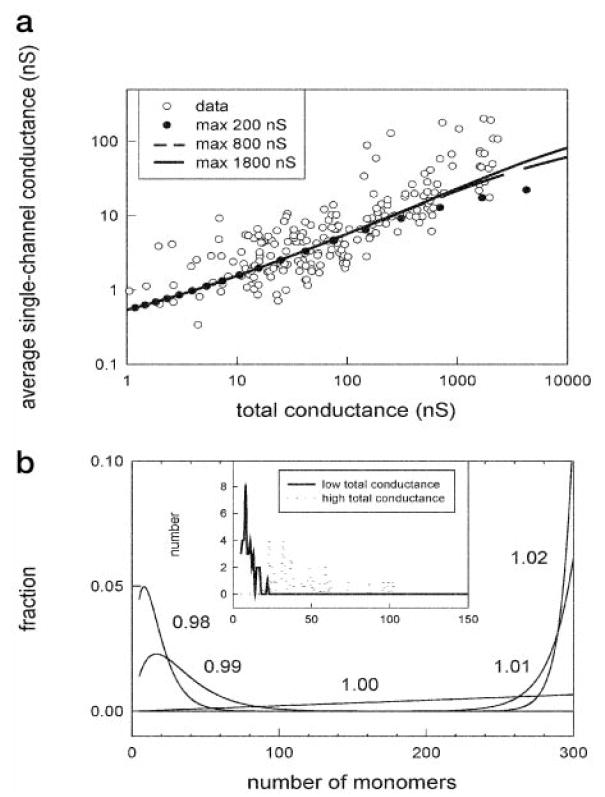
a, the average single channel conductance increased as the total conductance increases. The dots are individual experimental observations, and Equation 4 was used to generate the fitted lines. The size of the largest possible channel was chosen to be 200, 800, or 1800 nS. b, the main figure is a theoretical distribution of single-channel sizes as a function of ceramide monomer concentration in the membrane (numbers next to curves). The inset is a plot of the number of channels observed that would correspond to channels with the indicated number of monomers. The solid line represents the channels formed at low membrane conductance (bottom fifth), and the dotted line represents the channels formed at high conductance (top fifth).