
Fig. 2.
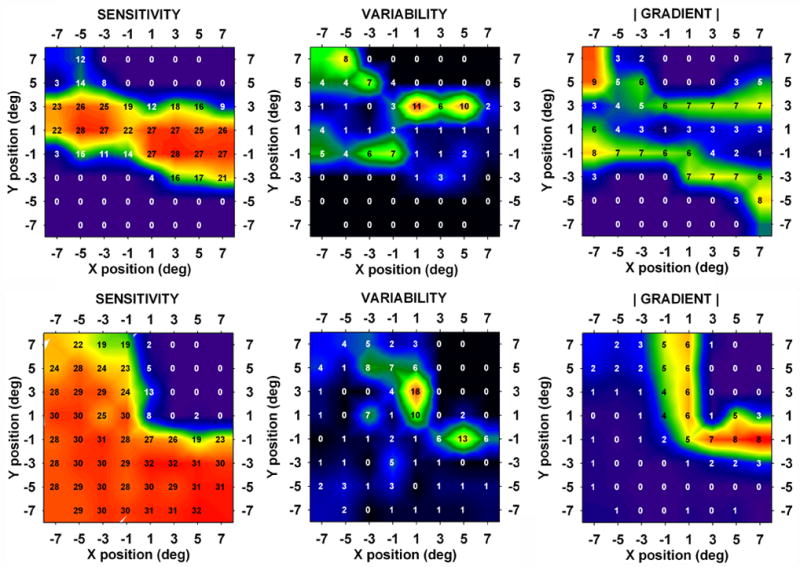
Contour plots of average sensitivity, variability (i.e., the SD) and |gradient|. Average sensitivity values are superimposed on the plots. Top row: patient of Fig. 1. Correlation (variability, |gradient|) = 0.651. Bottom row: Visual field data from a 68 year old patient with glaucoma. Correlation (variability, |gradient|) = 0.593.