
Fig. 5.
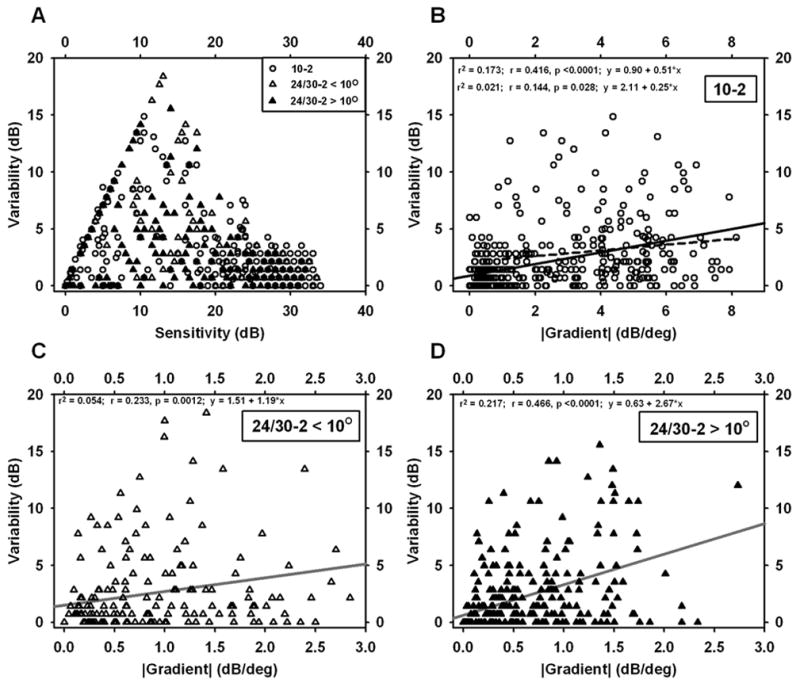
Scatterplots for individual test locations in visual fields of patients glaucoma. A. Variability vs. Sensitivity. B–D. Variability vs. |Gradient|. B. 10-2 data. C. 24-2 data for eccentricities < 10 deg. D. 24-2 data for eccentricities > 10 deg. Note the shorter gradient axis in C and D compared to B; gradients from 24-2 data were all < 3.0. Linear regressions are included in B–D; the dashed line in B is the regression after exclusion of points with gradients less than 1.