Fig. 6.

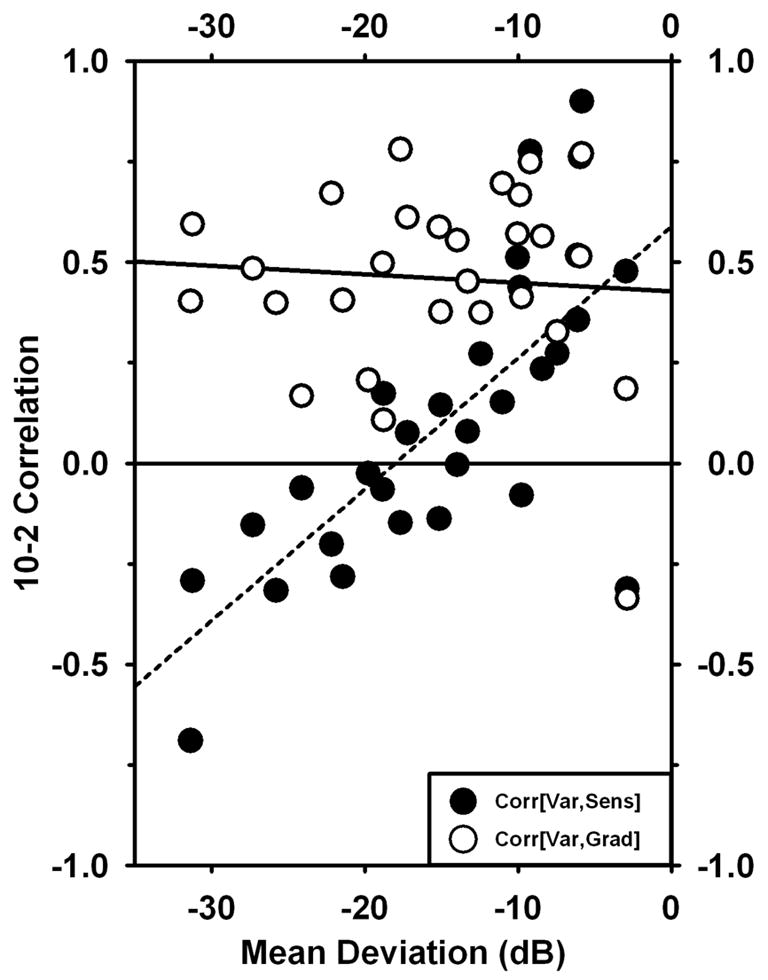
Matrix correlations based on 10-2 data plotted against Mean Deviation for the same eye. Filled circles represent correlations of Variability with −1*Sensitivity; open circles represent correlations of Variability with |gradient|.

Matrix correlations based on 10-2 data plotted against Mean Deviation for the same eye. Filled circles represent correlations of Variability with −1*Sensitivity; open circles represent correlations of Variability with |gradient|.