
Fig. 8.
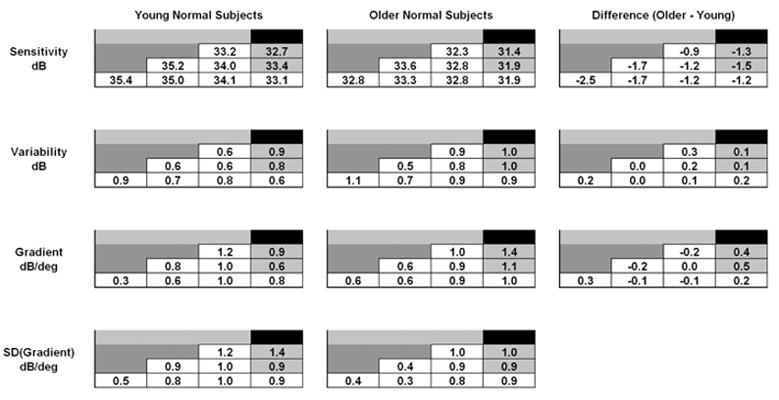
Average sensitivity, variability, and gradient values for young normal subjects (left column) and older normal subjects (middle column). Values have been averaged into one half-quadrant. Values in open cells are for core locations (compare to Fig. 1A). Differences between the two groups are shown in the right column.