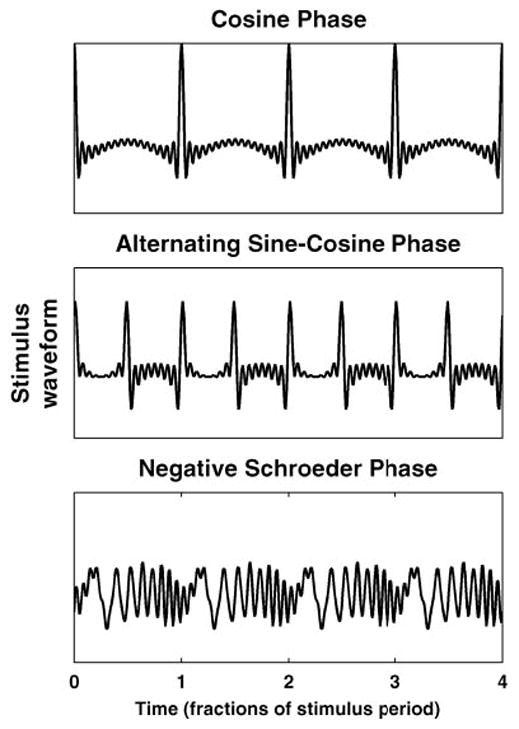
Fig. 1.

Different phase relationships among harmonics give rise to different stimulus waveforms. For harmonics in cosine phase (top), waveform shows one peak per period of fundamental frequency (F0). When the harmonics are in alternating phase (middle), waveform peaks twice every period of the F0. A negative Schroeder phase relationship among the harmonics (bottom) minimizes amplitude of oscillations of the envelope of waveform.
