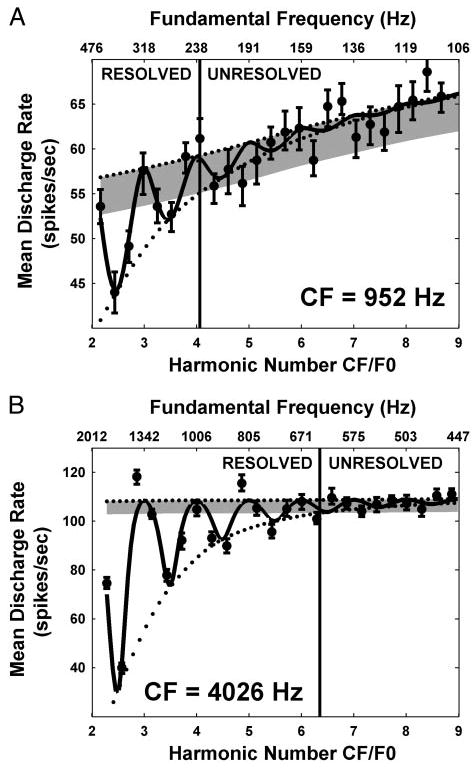
Fig. 3.

Average discharge rate against complex-tone F0 for 2 auditory nerve (AN) fibers from the same cat with characteristic frequencies (CFs) of 952 (A) and 4,026 Hz (B). Because the bottom axis shows the harmonic number CF/F0, F0 increases from right to left along the top axis. Filled circles with error bars show mean discharge rate ± SD obtained by bootstrap resampling of the stimulus trials. Solid lines show response of best-fitting single-fiber model (Fig. 2). The top and bottom envelopes of the fitted curve are shown by dotted lines. Intersection of the bottom envelope with 2 typical SD from the top envelope (gray shading) gives the maximum harmonic number Nmax for which harmonics are resolved (vertical lines).
