
Fig. 4.
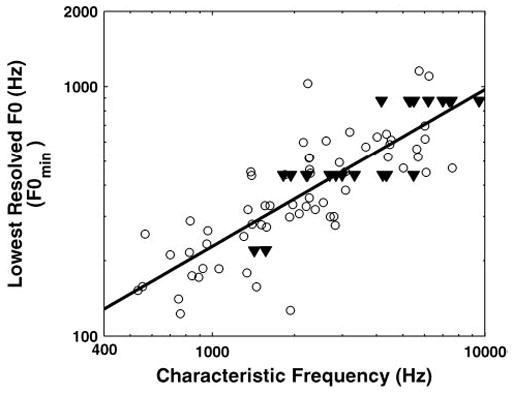
Lowest resolved F0 as a function of CF. Each point shows data from 1 AN fiber. Triangles show data points for which F0min was somewhat overestimated because harmonics were still resolved for the lowest F0 presented. Solid line shows best-fitting straight line on double logarithmic coordinates (a power law).