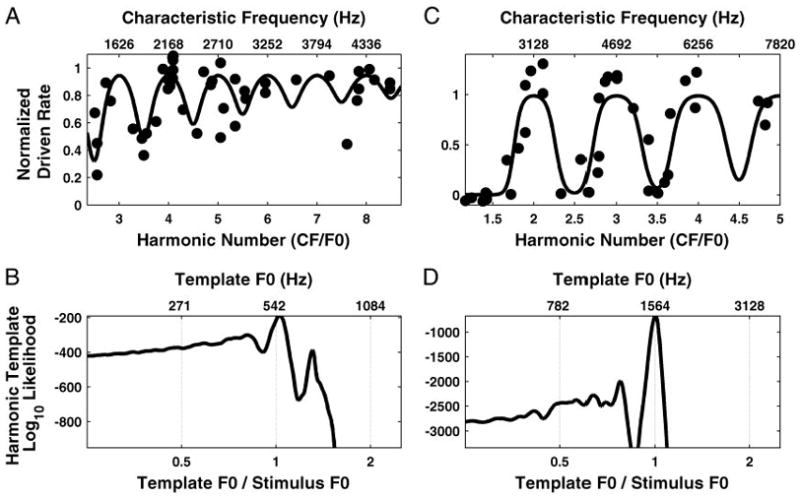
Fig. 6.

Maximum-likelihood pitch estimation from rate-place profiles using harmonic templates for 2 complex tones with F0s at 542 (A and B) and 1,564 Hz (C and D), respectively. A and C: filled circles show normalized driven rate as a function of both CF (top axis) and harmonic number CF/F0 (bottom axis). Solid lines show maximum-likelihood harmonic template, which is the response of a population model to a complex tone with equal-amplitude harmonics. B and D: log-likelihood of the harmonic template model in producing the data points as a function of template F0.
