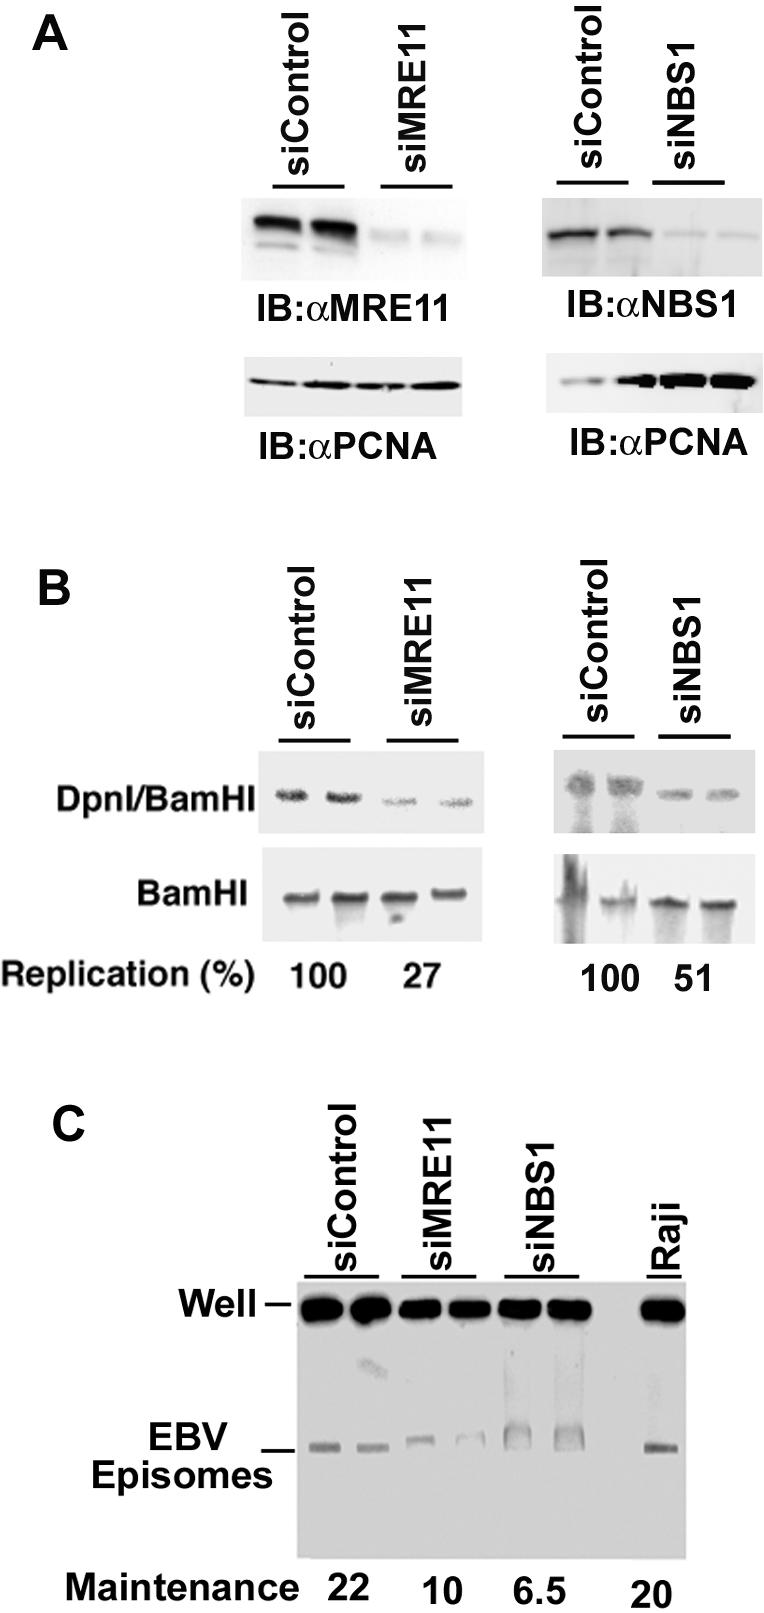
Figure 2. MRE11 and NBS1 contribute to OriP replication and EBV episome stability.

A) D98/HR1 cells were transfected with siRNA for MRE11 or NBS1, or Luciferase control and assayed by immuno-blot (IB) with antibodies specific for MRE11 (left pane) or NBS1 (right panel), or PCNA (lower panel) as a loading control. B) Transient DNA replication assays of OriP-containing plasmids were analyzed by Southern blot. D98/HR1 cells were transfected with OriP plasmid and siRNA for either MRE11, NBS1, or luciferase control (as indicated above each lane). Hirt extracted plasmid DNA was digested with DpnI plus BamHI (top panel) or BamHI only (lower panel) and probed with OriP specific probes. DNA was quantified by PhosphorImager analysis and the replication value was determined as the ratio of DpnI/BamHI to BamHI recovered products. Quantification shown below is a summary of at least four independent replication assays (data not shown). C)) EBV episomes from latently infected D98/HR1 cells were analyzed by pulse field electrophoresis and Southern blotting after transfection of siRNA for control (siLuc), MRE11, or NBS1. Raji cells were used as a control for EBV episome size and abundance. The percentage of EBV episomes relative to the EBV DNA retained in the well is calculated below.
