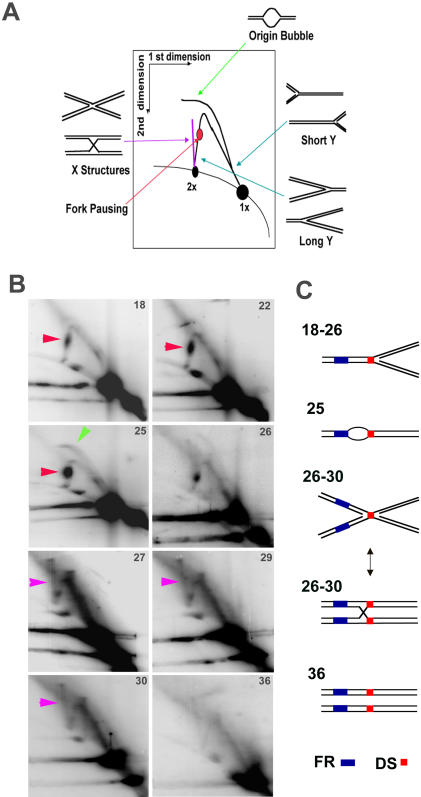
Figure 5. Cell cycle analysis of replication and recombination structures formed at OriP DNA.
A) Schematic of replication and recombination-associated DNA structures resolved by 2-dimensional neutral agarose gels. Holliday junction and X-like structures migrate as a vertical spike emerging from the 2n spot (shown in magenta). The bubble arc (shown in green) and replication fork pause sites (shown in red) are also indicated. B) Two dimensional neutral agarose gel analysis of OriP isolated using CTAB method from Mutu I cells after cell cycle fractionation. Cell cycle fractions from centrifugal elutration are indicated in the upper right corner of each image. C) Cartoon interpretation of the major OriP DNA structures observed for each cell cycle fraction in panel C.

