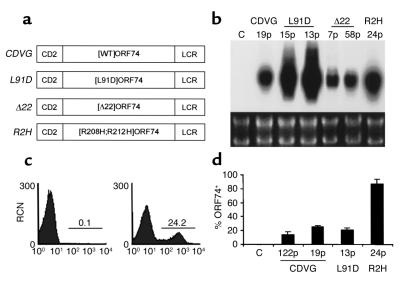
Figure 2.
Generation and expression analysis of ORF74 transgenic mice. (a) Schematic description of the transgenes CDVG, L91D, Δ22, and R2H. Mutant forms of ORF74 described in Figure 1 were cloned into a vector containing the hCD2 promoter and locus control region (LCR). (b) Northern blot analysis of thymic RNA from control and transgenic mice. Shown are representative samples from CDVG (line 19), L91D (lines 15 and 13), Δ22 (lines 7 and 58), and R2H (line 24) animals. Lower panel shows the ethidium bromide–stained RNA gels. (c) Histogram of ORF74 expression on thymic cells from control and CDVG (line 19) transgenic mice. Transgene expression is distinct and easily detectable at the cell surface by flow cytometry. (d) Relative number of thymocytes expressing ORF74, estimated by flow cytometry, in CDVG (lines 19 and 122), L91D (line 13), and R2H (line 24). Bars represent average ± SD (n = 3). p, progeny.

