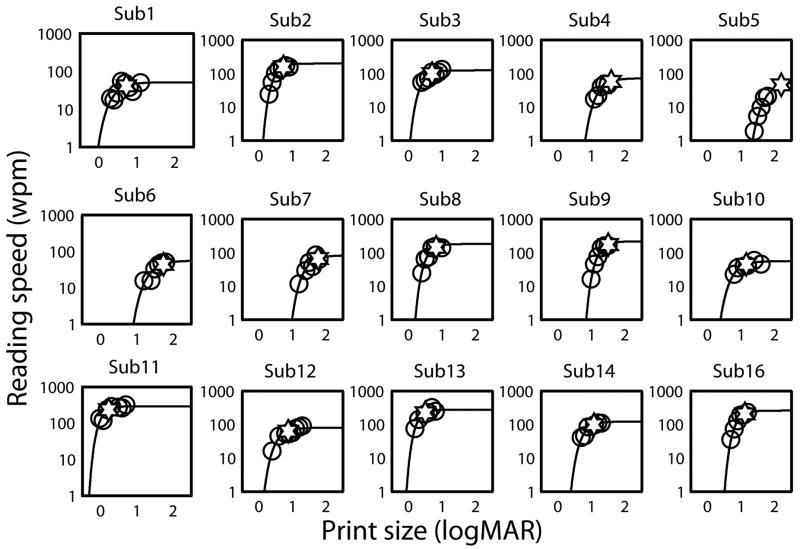
Figure 3. Individual plots of RSVP reading Speed as a function of print size fitted by a non-linear mixed effects model (NLME) for MD subjects.
Plots of RSVP reading speed (open circles) versus print size are shown for MD subjects. The data are fitted by exponential functions (solid curves) using the non-linear mixed effects method. Critical print size (CPS), represented by a star is the print size yielding 80% of the maximum reading speed.

