
Figure 4. A. RSVP reading speed versus Letter-recognition temporal threshold for 14 MD subjects.
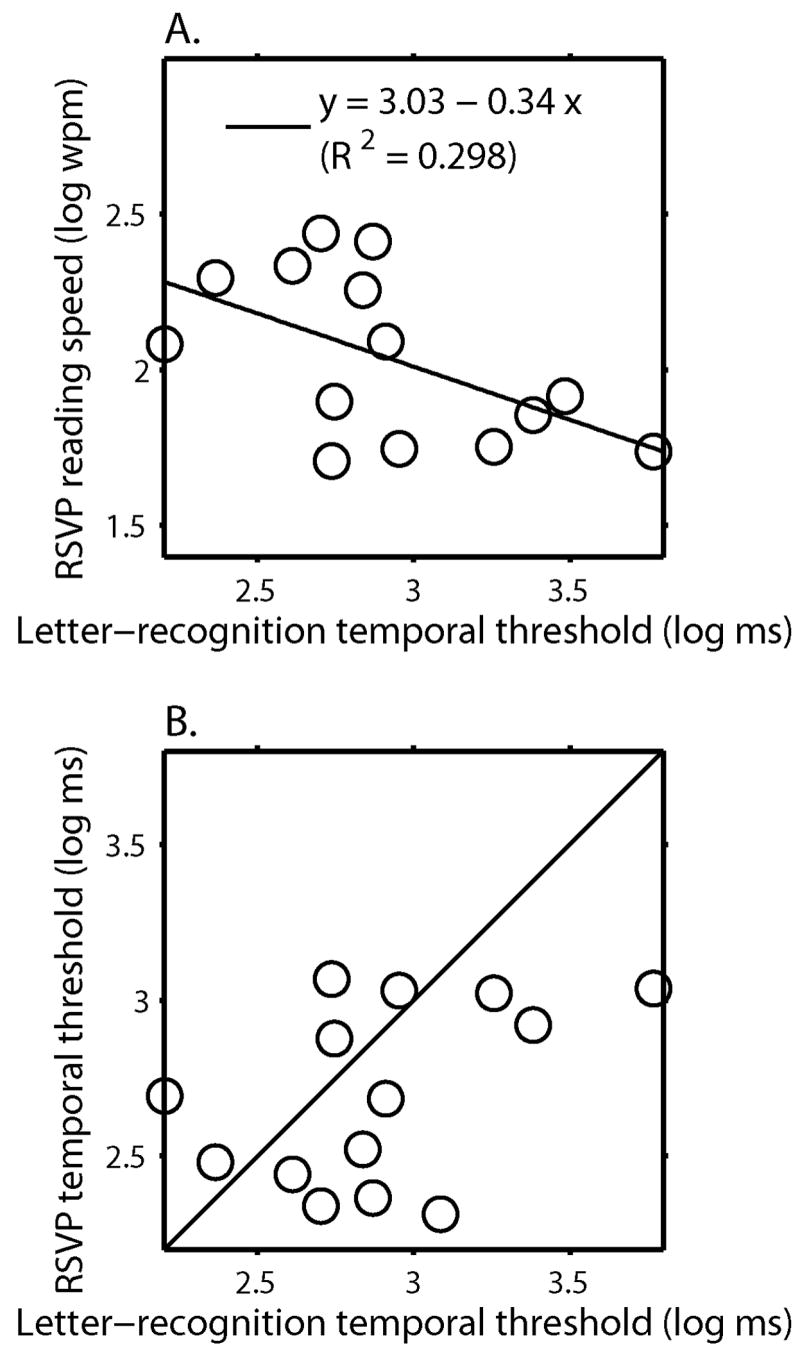
Log RSVP maximum reading speed was plotted as a function of log threshold duration for letter recognition. The dark line represents the least-squares regression line.
B. RSVP word-exposure time versus Letter-recognition temporal threshold for 14 MD subjects Log word exposure time associated with RSVP maximum reading speed was plotted as a function of log threshold duration for letter recognition. The solid line is the equality line showing what would be expected if temporal thresholds for letter recognition are equal to RSVP word-recognition times. The temporal thresholds for letter recognition average 17% longer than the word-recognition times.