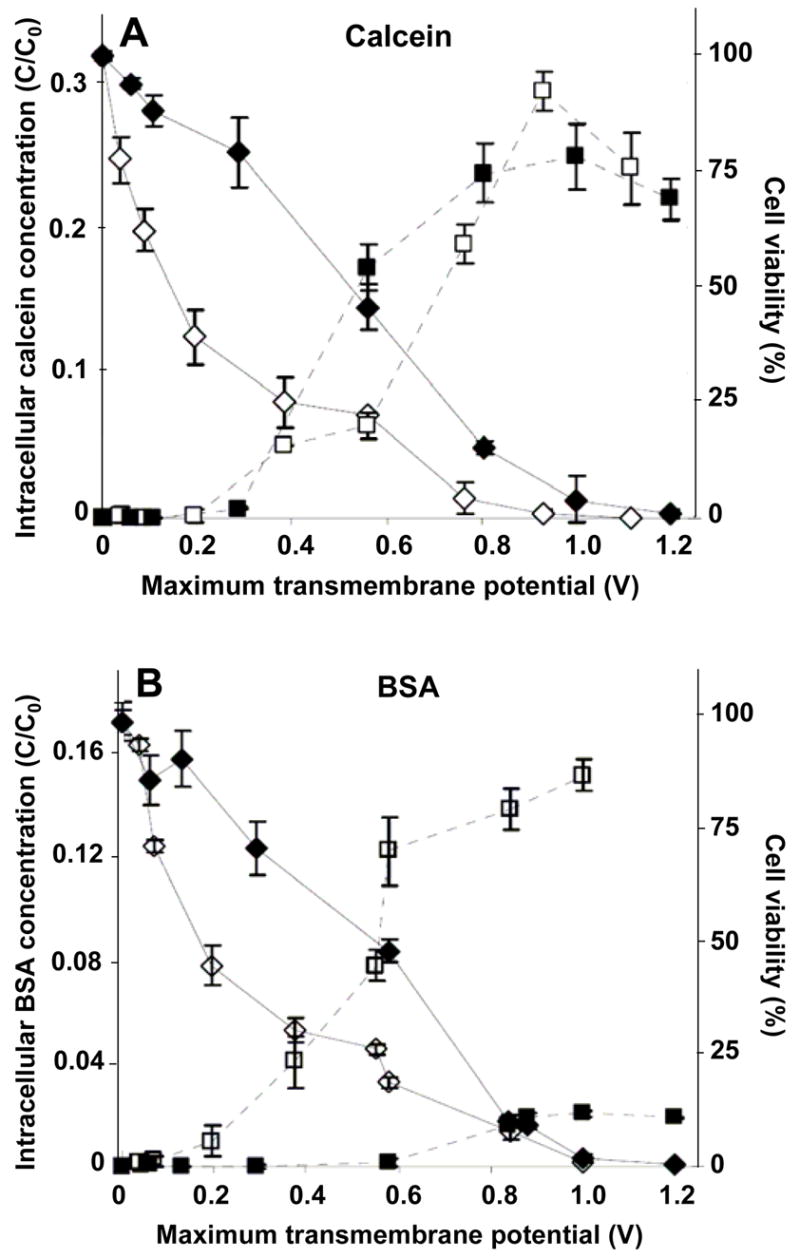
Figure 1.

Influence of the cell wall on intracellular uptake and cell viability as a function of transmembrane potential during electroporation. The normalized intracellular concentration of a small molecule, calcein (A), and a macromolecule, BSA (B), is shown versus the nominal, applied, maximum, transmembrane potential for two 1-ms electroporation pulses. For the same population of cells, the cell viability is also shown. The black and white symbols represent data from the wild-type and wall-deficient algal cells, respectively. The square and diamond symbols represent intracellular concentration and cell viability, respectively. These data show that although both cell strains took up similar amounts of calcein, wild-type cells took up significantly less BSA than wall-deficient cells.
