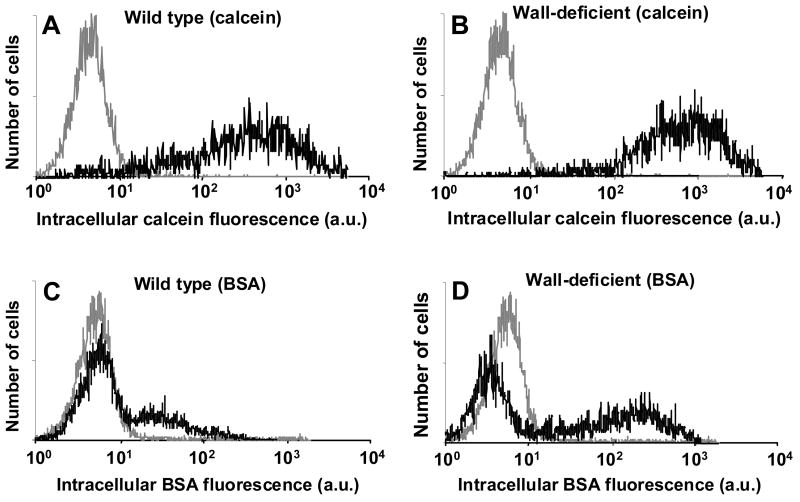
Figure 2.
Histograms of intracellular uptake on a per-cell basis measured by cell fluorescence representative of the data shown in Figure 1. Uptake of calcein (A, B) and BSA (C, D) is shown in wild-type (A, C) and wall-deficient (B, D) cells. In each graph, the gray curve represents fluorescence of control cells and the black curve represents fluorescence of electroporated cells. Intracellular fluorescence is reported in arbitrary flow cytometry units. Each histogram contains data from 20,000 cells.

