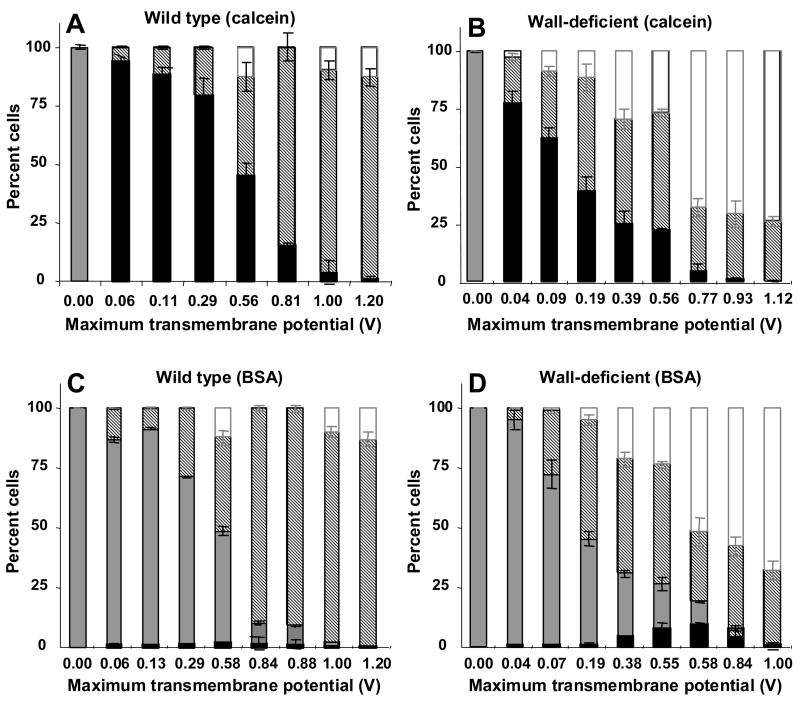
Figure 3.
Influence of the cell wall on intracellular uptake and cell viability as a function of transmembrane potential during electroporation. Uptake of calcein (A, B) and BSA (C, D) is shown in wild-type (A, C) and wall-deficient (B, D) cells. All cells exposed to electroporation have been categorized as (i) viable cells with uptake (black bar), (ii) viable cells without uptake (gray bar), (iii) non-viable cells (striped bar) and (iv) lysed cells (white bar). Note that the height of the black-plus-gray bars shows the overall level of cell viability. This figure was generated using data from Figure 1 that were reanalyzed using histograms like those shown in Figure 2. This analysis demonstrates that essentially all electroporated cells took up calcein, but only some cells took up BSA, where a larger fraction of wall-deficient cells took up BSA than wild-type cells.

