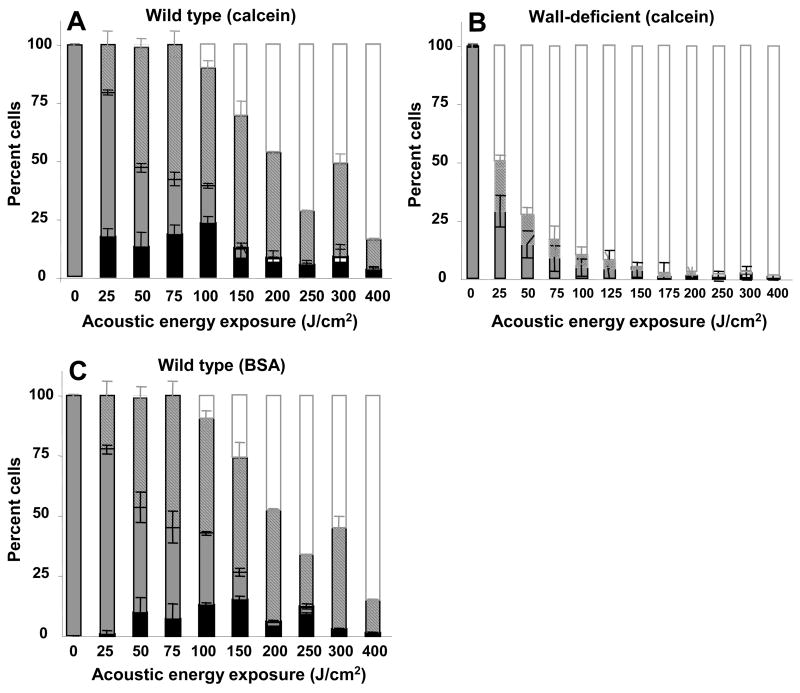
Figure 6.
Influence of the cell wall on intracellular uptake and cell viability as a function of energy exposure during sonication. Uptake of calcein (A, B) and BSA (C) is shown in wild-type (A, C) and wall-deficient (B) cells. All cells exposed to sonication have been categorized as (i) viable cells with uptake (black bar), (ii) viable cells without uptake (gray bar), (iii) non-viable cells (striped bar) and (iv) lysed cells (white bar). Note that the height of the black-plus-gray bars shows the overall level of cell viability. This figure was generated using data from Figure 4 that were reanalyzed using histograms like those shown in Figure 5. This analysis shows that similar fractions of wild-type and wall-deficient cells took up calcein and BSA, but essentially no wall-deficient cells took up molecules.

