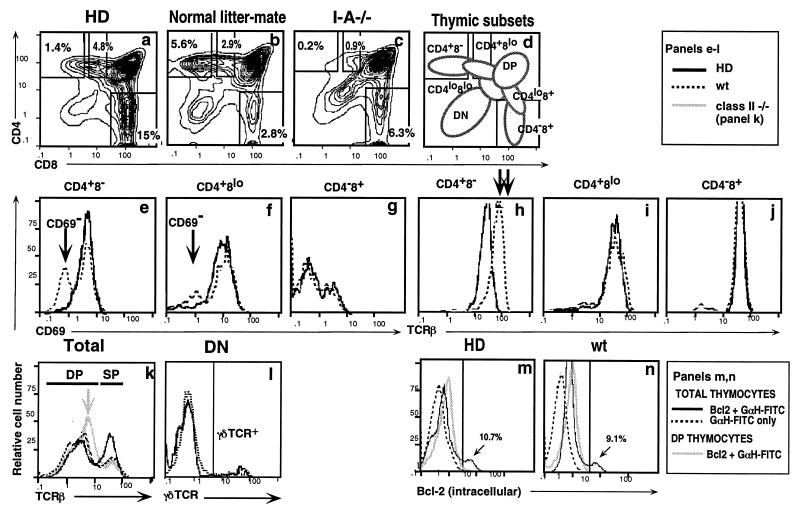
Figure 3.
Thymic development of CD4 lineage cells is abrogated in HD mice. Thymocytes from HD mice, normal littermates, or MHC class II-deficient controls were stained with antibodies specific for CD4, CD8, αβTCR, and CD69 and analyzed by flow cytometry. Histograms represent total thymocytes (a–c and k) or thymic subsets, as specified. In e–l, solid and dashed dark lines correspond to HD and wt mice, respectively, whereas the solid light line in k represents class II−/− mice. In m and n, solid and dashed dark lines correspond to total thymocytes stained either with anti-Bcl-2 and fluoresceinated goat anti-hamster fluorescein isothiocyanate (GαH–FITC) or only GαH–FITC, respectively, whereas the solid light lines represent DP thymocytes stained with anti-Bcl-2 and GαH-FITC. Bcl-2high populations correspond to SP thymocytes. Thymic subset designations are defined in d. Gates used to define CD4+8−, CD4+8low, and CD4−8+ subsets are shown in a–c. Arrows point out key differences between HD mice and wt or class II−/− controls as follows: In e and f, arrows identify the mature CD69− population that is present in wt but absent in HD mice. In h, arrows highlight the 2-fold difference in TCR expression between CD4+8− cells from HD versus wt mice. In k, the arrow highlights the higher TCR expression levels seen on DP thymocytes from class II−/− but not HD or wt mice.

