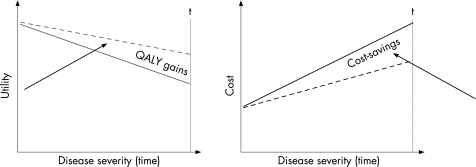
Figure 4 Hypothesis for economic evaluation in RA. Cost increase and quality of life (QoL) decreases as the disease worsens (solid lines). If a treatment succeeds in changing the speed of the progression, the slopes of the cost and QoL curves change (dotted lines). The area between the curves will then, over a given timeframe, represent the health gains and cost savings. QALY, quality‐adjusted live year.

An official website of the United States government
Here's how you know
Official websites use .gov
A
.gov website belongs to an official
government organization in the United States.
Secure .gov websites use HTTPS
A lock (
) or https:// means you've safely
connected to the .gov website. Share sensitive
information only on official, secure websites.
