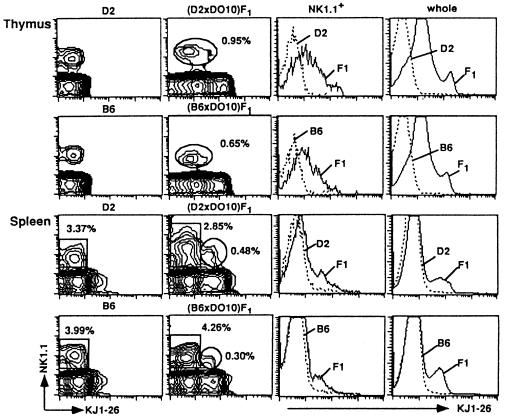
Figure 1.
Analysis of NK1.1 expression on thymocytes and spleen cells from D2, B6, (D2 × DO10)F1, and (B6 × DO10)F1 mice. Thymocytes and splenocytes were stained with PE-anti-NK1.1 and biotin-KJ1-26 followed by Streptavidin-FITC. The proportions of NK1.1+KJ1-26+ cells (thymus) and NK1.1+KJ1-26− and NK1.1+ KJ1-26+ cells (spleen) of (D2 × DO10)F1 and (B6 × DO10)F1 mice are indicated (Middle Left). Fluorescence intensities of KJ1-26 among the NK1.1+ population in the thymus as well as in whole thymocyte and splenocyte populations are also shown in the histograms to compare those between D2 and (D2 × DO10)F1 or between B6 and (B6 × DO10)F1, respectively (Right).

