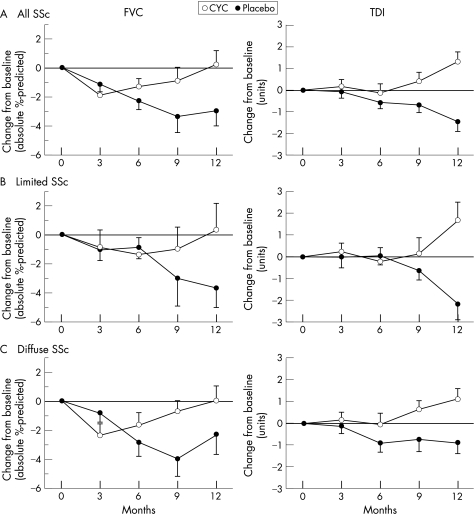
Figure 2 Changes over 12 months in patients on Placebo vs CYC. The adjusted change from baseline for the FVC (absolute percentage predicted) and for the TDI (total score in Units) were calculated for patients in the Placebo and CYC treatment groups for all individuals in the study (A, n = 66 for CYC, 64 for Placebo), those with Limited SSc (B, n = 26 for CYC, 26 for Placebo), and patients with Diffuse SSc (C, n = 40 for CYC, 38 for Placebo) using a multivariate model accounting for differences in the Maximal Fibrosis Score on HRCT as measured at baseline. Median (FVC) and mean (TDI) values±SE.

An official website of the United States government
Here's how you know
Official websites use .gov
A
.gov website belongs to an official
government organization in the United States.
Secure .gov websites use HTTPS
A lock (
) or https:// means you've safely
connected to the .gov website. Share sensitive
information only on official, secure websites.
