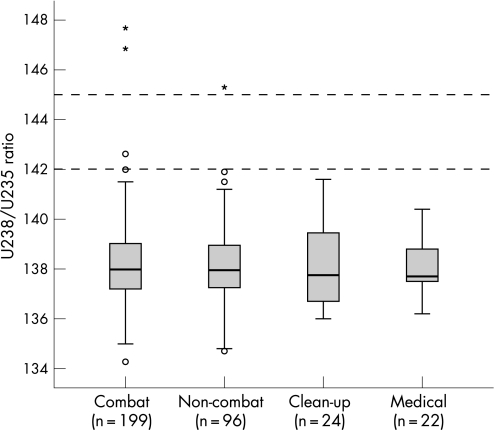
Figure 1 Boxplots summarising the spread and shape of the distribution of the 238U/235U ratio for each group. Horizontal bands indicate medians. The shaded boxes represent the 25th to 75th centiles. Circles represent outliers between 1.5 to 3 box lengths from the 25th or 75th centiles. Cases marked * indicate outliers greater than 3 box lengths from the 25th or 75th centiles. Whisker lines show the largest values that are not outliers. Horizontal dashed lines correspond to Scientifics Ltd's guidelines for reporting samples as indicating possible exposure to depleted uranium (142) and probable exposure to depleted uranium (145).

An official website of the United States government
Here's how you know
Official websites use .gov
A
.gov website belongs to an official
government organization in the United States.
Secure .gov websites use HTTPS
A lock (
) or https:// means you've safely
connected to the .gov website. Share sensitive
information only on official, secure websites.
