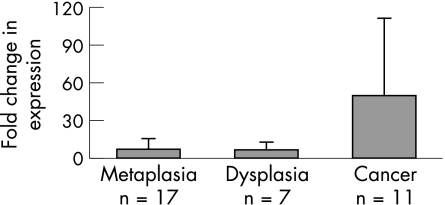
Figure 4 Real‐time PCR analysis of interleukin‐8 (IL‐8) across histological series. Expression is shown as fold change relative to matched squamous tissue. IL‐8 gene expression shows clear increased expression across the histological series and the fold increase relative to matched squamous tissue is significantly greater in adenocarcinoma tissue relative to Barrett's tissue (p = 0.010).

An official website of the United States government
Here's how you know
Official websites use .gov
A
.gov website belongs to an official
government organization in the United States.
Secure .gov websites use HTTPS
A lock (
) or https:// means you've safely
connected to the .gov website. Share sensitive
information only on official, secure websites.
