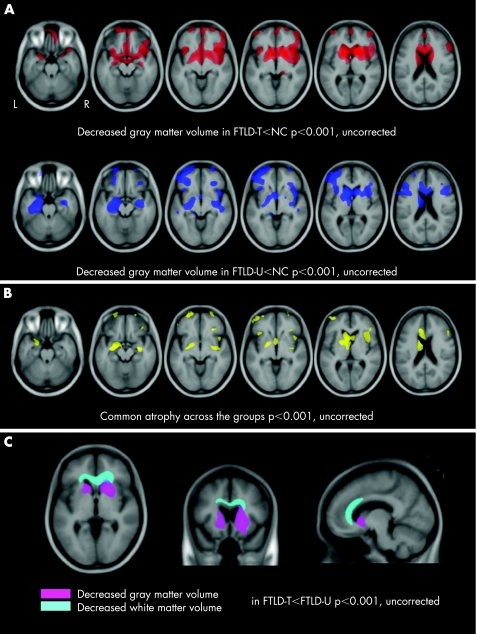
Figure 1 Patterns of gray matter loss in frontotemporal lobar degeneration (FTLD) pathological subtypes. T score maps are displayed on multiple axial sections on a study specific template. L, left; R, right. (A) Gray matter loss in FTLD with tau positive inclusions (FTLD‐T, upper row) and FTLD with ubiquitin and TDP‐43 positive/tau negative inclusions (FTLD‐U, bottom row) compared with normal controls (NC). (B) Common regions of gray matter loss found in both groups compared with controls. (C) Regions of greater gray matter loss (displayed in pink) and white matter loss (displayed in sky blue) in FTLD‐T compared with FTLD‐U. T score maps are presented on axial (z = −1), coronal (y = 13) and sagittal (x = −10) sections of a study specific template.

An official website of the United States government
Here's how you know
Official websites use .gov
A
.gov website belongs to an official
government organization in the United States.
Secure .gov websites use HTTPS
A lock (
) or https:// means you've safely
connected to the .gov website. Share sensitive
information only on official, secure websites.
