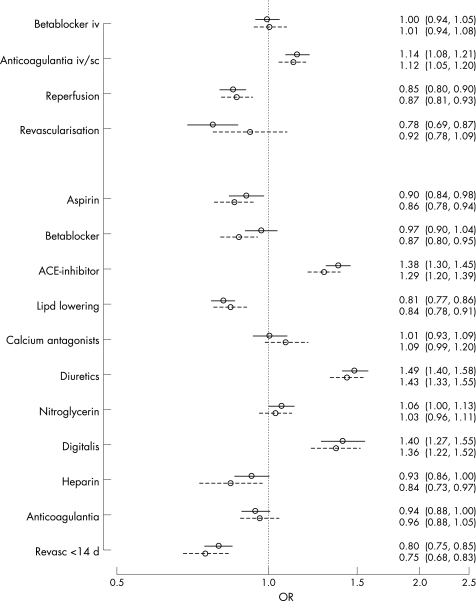
Figure 1 Propensity score adjusted OR for prescription of in‐hospital (top four) and at discharge (bottom 11) treatment modalities in patients with and without diabetes and MI in 1995–1998 (dashed line) and 1999–2002 (solid line). Treatments with an OR >1.0 are given more often to patients with diabetes.

An official website of the United States government
Here's how you know
Official websites use .gov
A
.gov website belongs to an official
government organization in the United States.
Secure .gov websites use HTTPS
A lock (
) or https:// means you've safely
connected to the .gov website. Share sensitive
information only on official, secure websites.
