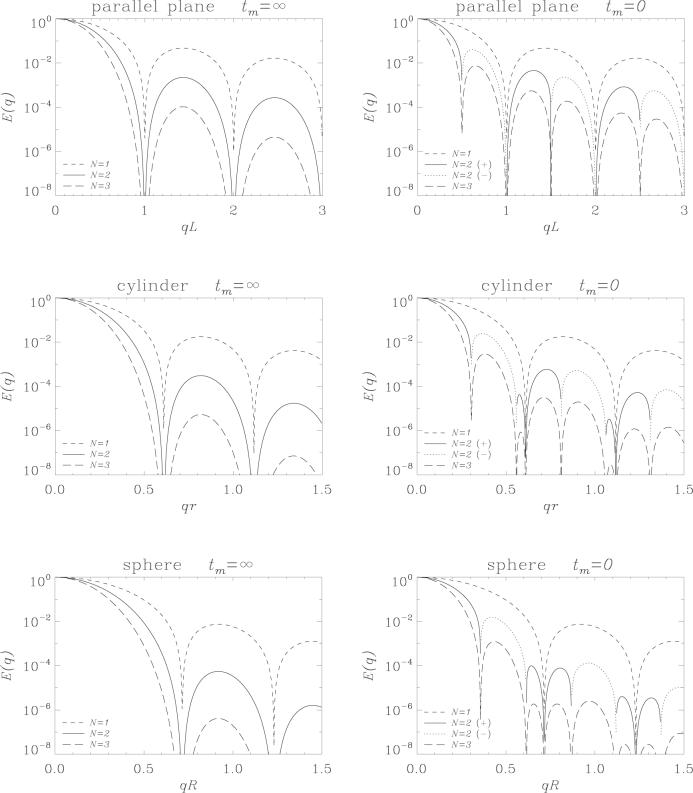
Figure 2.
Signal attenuation as a function of q with varying number of diffusion gradient pairs for parallel plane pore with spacing L (top), cylindrical pore with radius r (middle) and spherical pore with radius R (bottom). The left column shows the results obtained in the limit tm → ∞ whereas tm = 0 case was shown on the right column. In both cases δ = 0 and Δ → ∞. The continuous and dotted lines both illustrate the curve obtained with N = 2 where the former shows the positive sections and the latter shows the negative sections after flipping.

