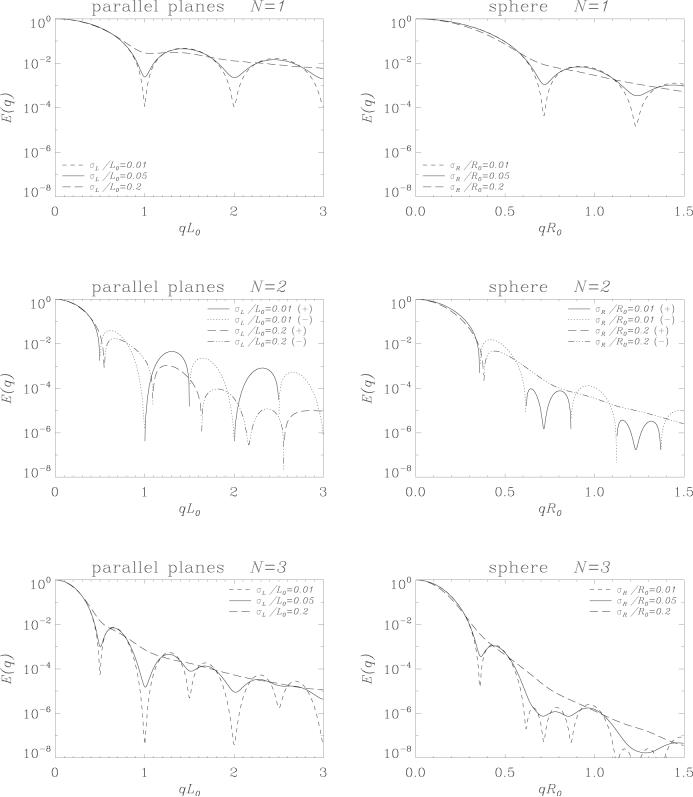
Figure 3.
Signal attenuation curves as a function of q from distributions of parallel planes (left column) and spheres (right column). The mean and standard deviation of the spacings of the parallel planes are denoted by L0 and σL whereas the mean and standard deviations of the radii of the spheres are denoted by R0 and σR respectively. Simulations of experiments with number of pulse pairs varying 1 through 3 (top to bottom) are shown. δ = tm = 0, Δ → ∞.

