
Fig. 9. Plot showing NER in the repressed ADH2 gene.
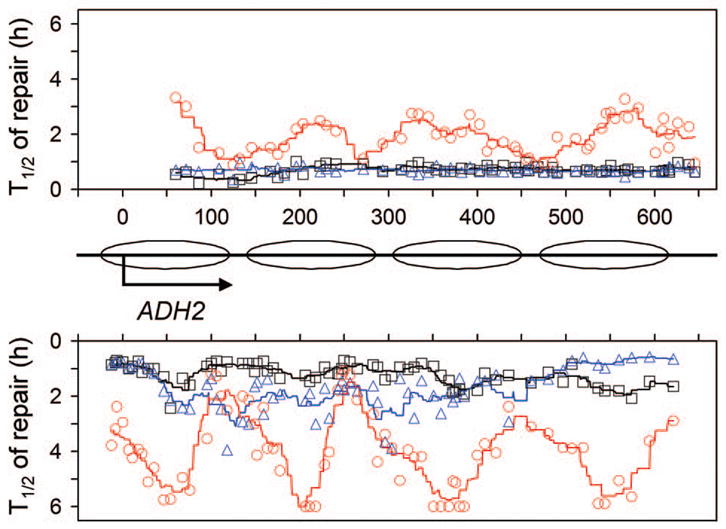
Upper and lower panels represent NTS and TS, respectively. Between the panels is a schematic diagram of the ADH2 gene, where ovals denote locations of nucleosomes [43]. Abscissa values are nucleotide positions relative to the transcription start site. Individual symbols in the plot represent time (in hours) required for repairing 50% (T1/2) CPDs at individual sites of the gene. Black squares, blue triangles and red circles represent wild type, rad16 and rad26 cells, respectively. Black, blue and red lines in the plot are smoothed T1/2 values for wild type, rad16 and rad26 cells, respectively. Smoothing was carried out by averaging the individual T1/2 values at continuous intervals of 40 nucleotides, where the 40 nucleotide brackets were ramped along the DNA by one nucleotide.