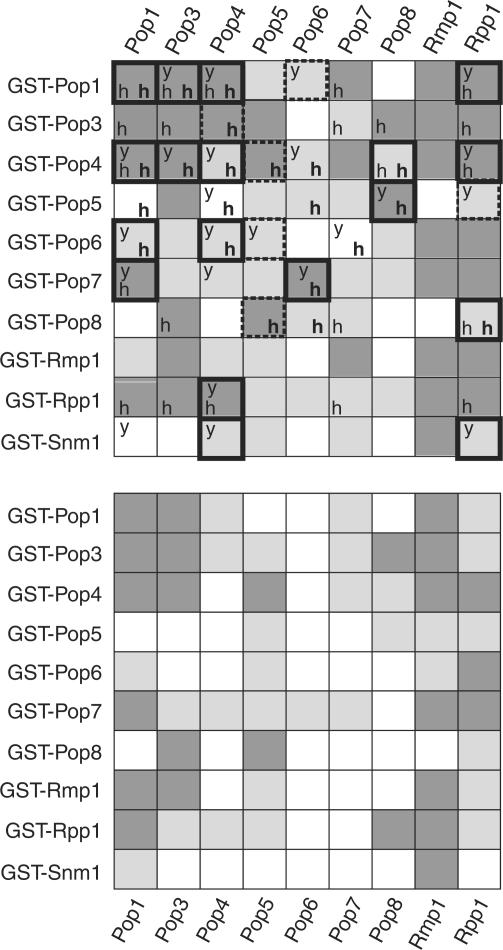
Figure 3.
Protein–protein interactions. Top panel: pairwise protein–protein interactions observed in the presence of 150 mM NaCl. Dark grey squares indicate strong protein-protein interactions, light grey squares indicate weak interactions and white squares indicate that no significant interaction occurred. A ‘y’ within a box indicates a protein–protein interaction also seen by Houser-Scott et al. (22) using the yeast two-hybrid system. An ‘h’ (in bold) indicates a protein–protein interaction observed by Welting et al., (24) using GST-pulldown experiments on the human homologues of yeast RNase MRP subunits [these being hPop1, Rpp38 (Pop3p), Rpp29 (Pop4p), hPop5, Rpp25 (Pop6p), Rpp20 (Pop7p), Rpp14 (Pop8p), Rpp30 (Rpp1p)]. An ‘h’ denotes a protein–protein interaction observed by Jiang et al. (22) in a yeast two-hybrid study of human RNase P. Bottom panel: protein–protein interactions observed in the presence of 300 mM NaCl. Thick borders indicate interactions that are conserved in at least 2 of the other 3 major studies of yeast and human subunits. The bordering is dashed if the interaction is conserved but under-represented by other studies.

